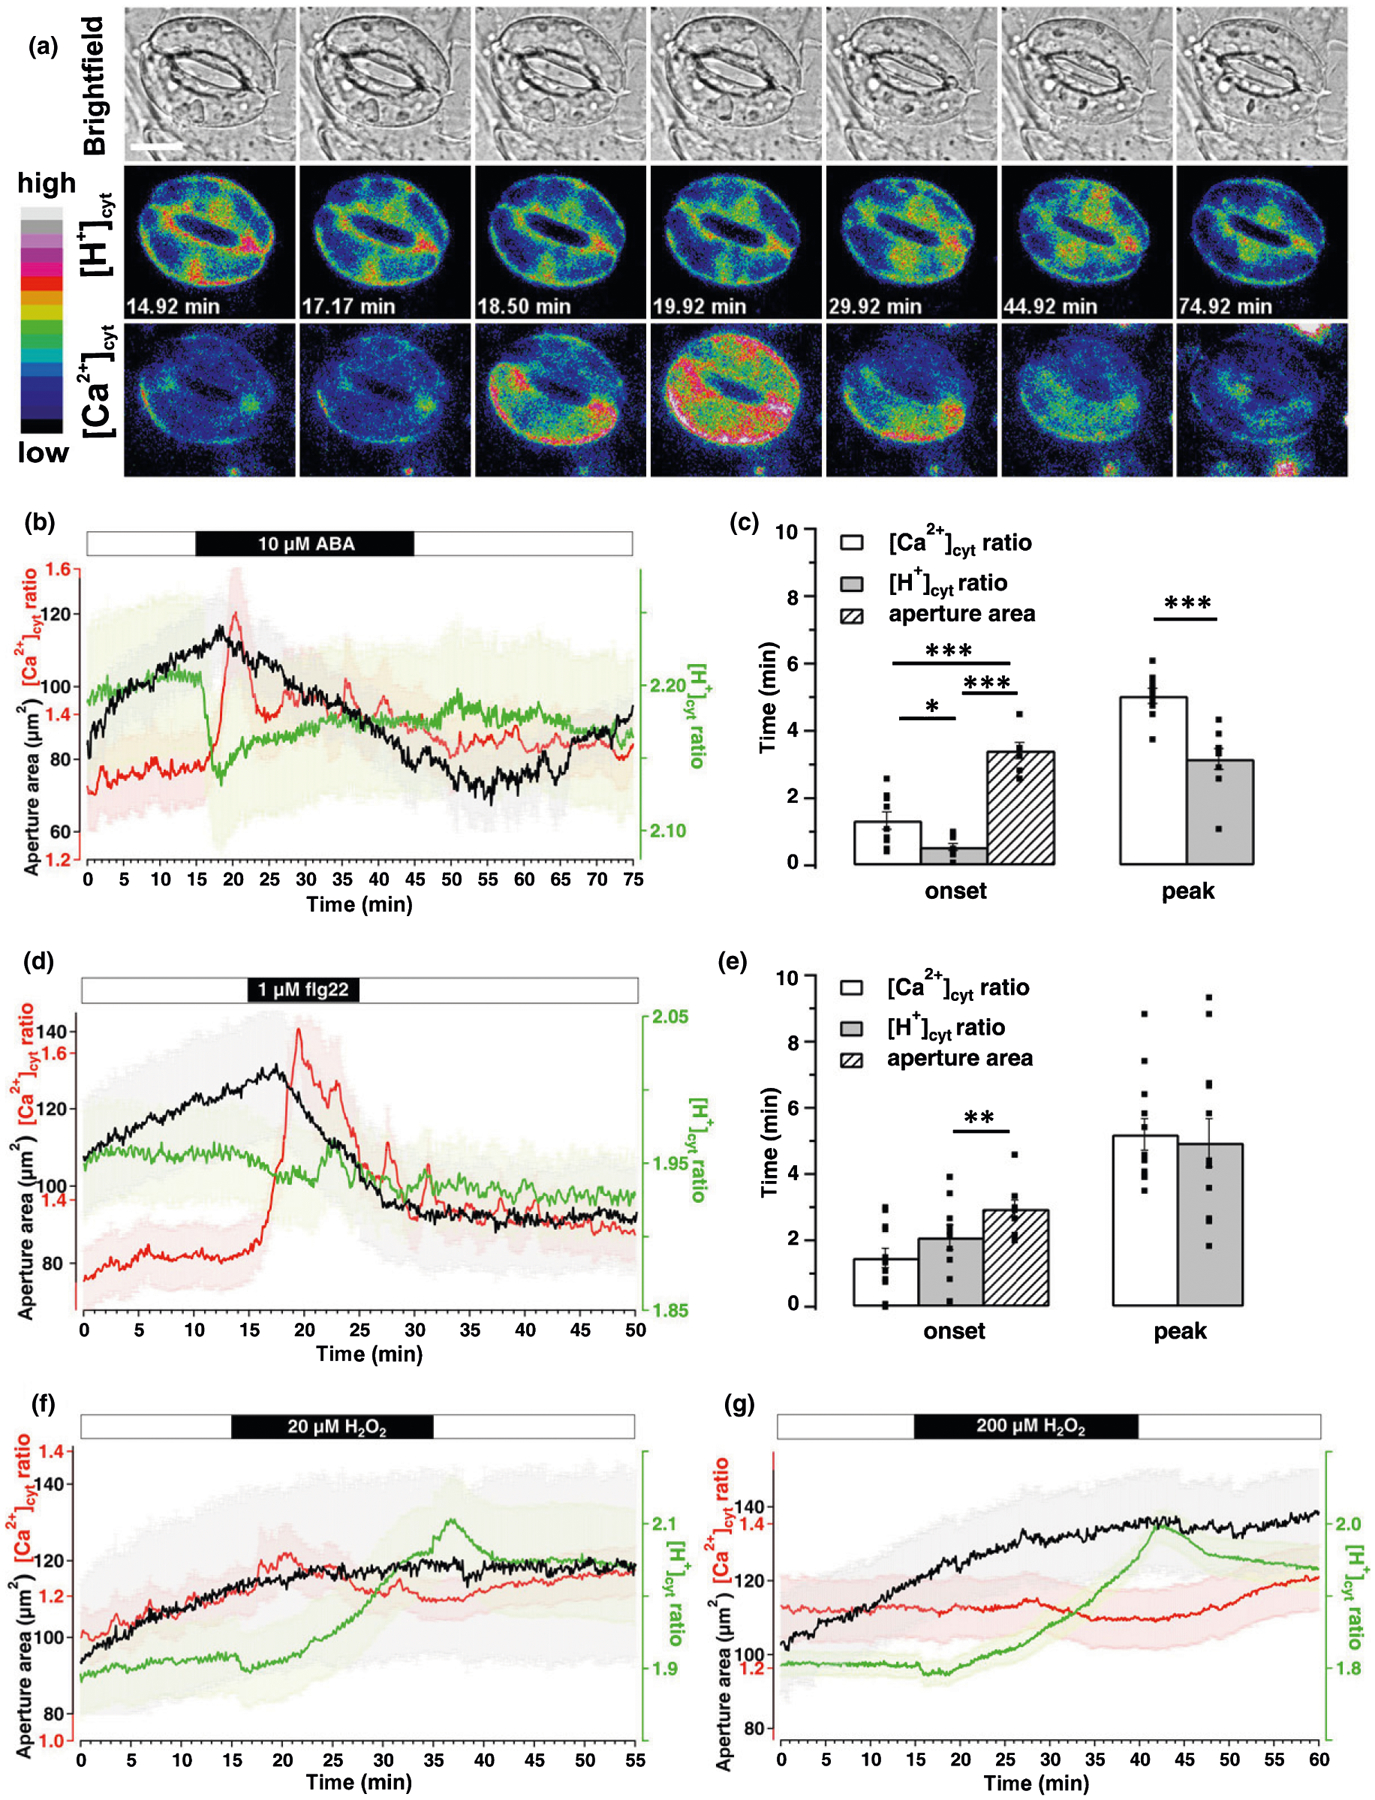
Fig. 4.

Different stimuli trigger distinct [Ca2+]cyt and [H+]cyt signatures in guard cells (GCs) during stomata movement. Time-lapse CapHensor imaging together with stomata aperture monitoring in GCs of Nicotiana tabacum epidermal strips. (a) Brightfield (top) as well as false colored [H+]cyt (middle) and [Ca2+]cyt (bottom) ratio images of a representative time-lapse CapHensor imaging series upon the application of 10 μM ABA. Bar, 20 μm. (b, d, f, g) Mean [Ca2+]cyt ratio (red), [H+]cyt ratio (green) and stomatal aperture area (black) over time upon application of (b) 10 μM ABA (n = 10), (d) 1 μM flg22 (n = 12), (f) 20 μM H2O2 (n = 10) and (g) 200 μM H2O2 (n = 22). The bars above the mean traces indicate the time of treatments. (c, e) Bar diagram displays the average time of the onset and to the peak-response after 10 μM ABA and 1 μM flg22 treatment from data shown in (b) and (d), respectively. Dots in (c) and (e) indicate individual measurements. Error bars = SE. The t-test was used for peak time analyses while one-way ANOVA was used for onset time analyses in (c) and (e). *, P < 0.05; **, P < 0.01; ***, P < 0.001.
