Fig. 6.

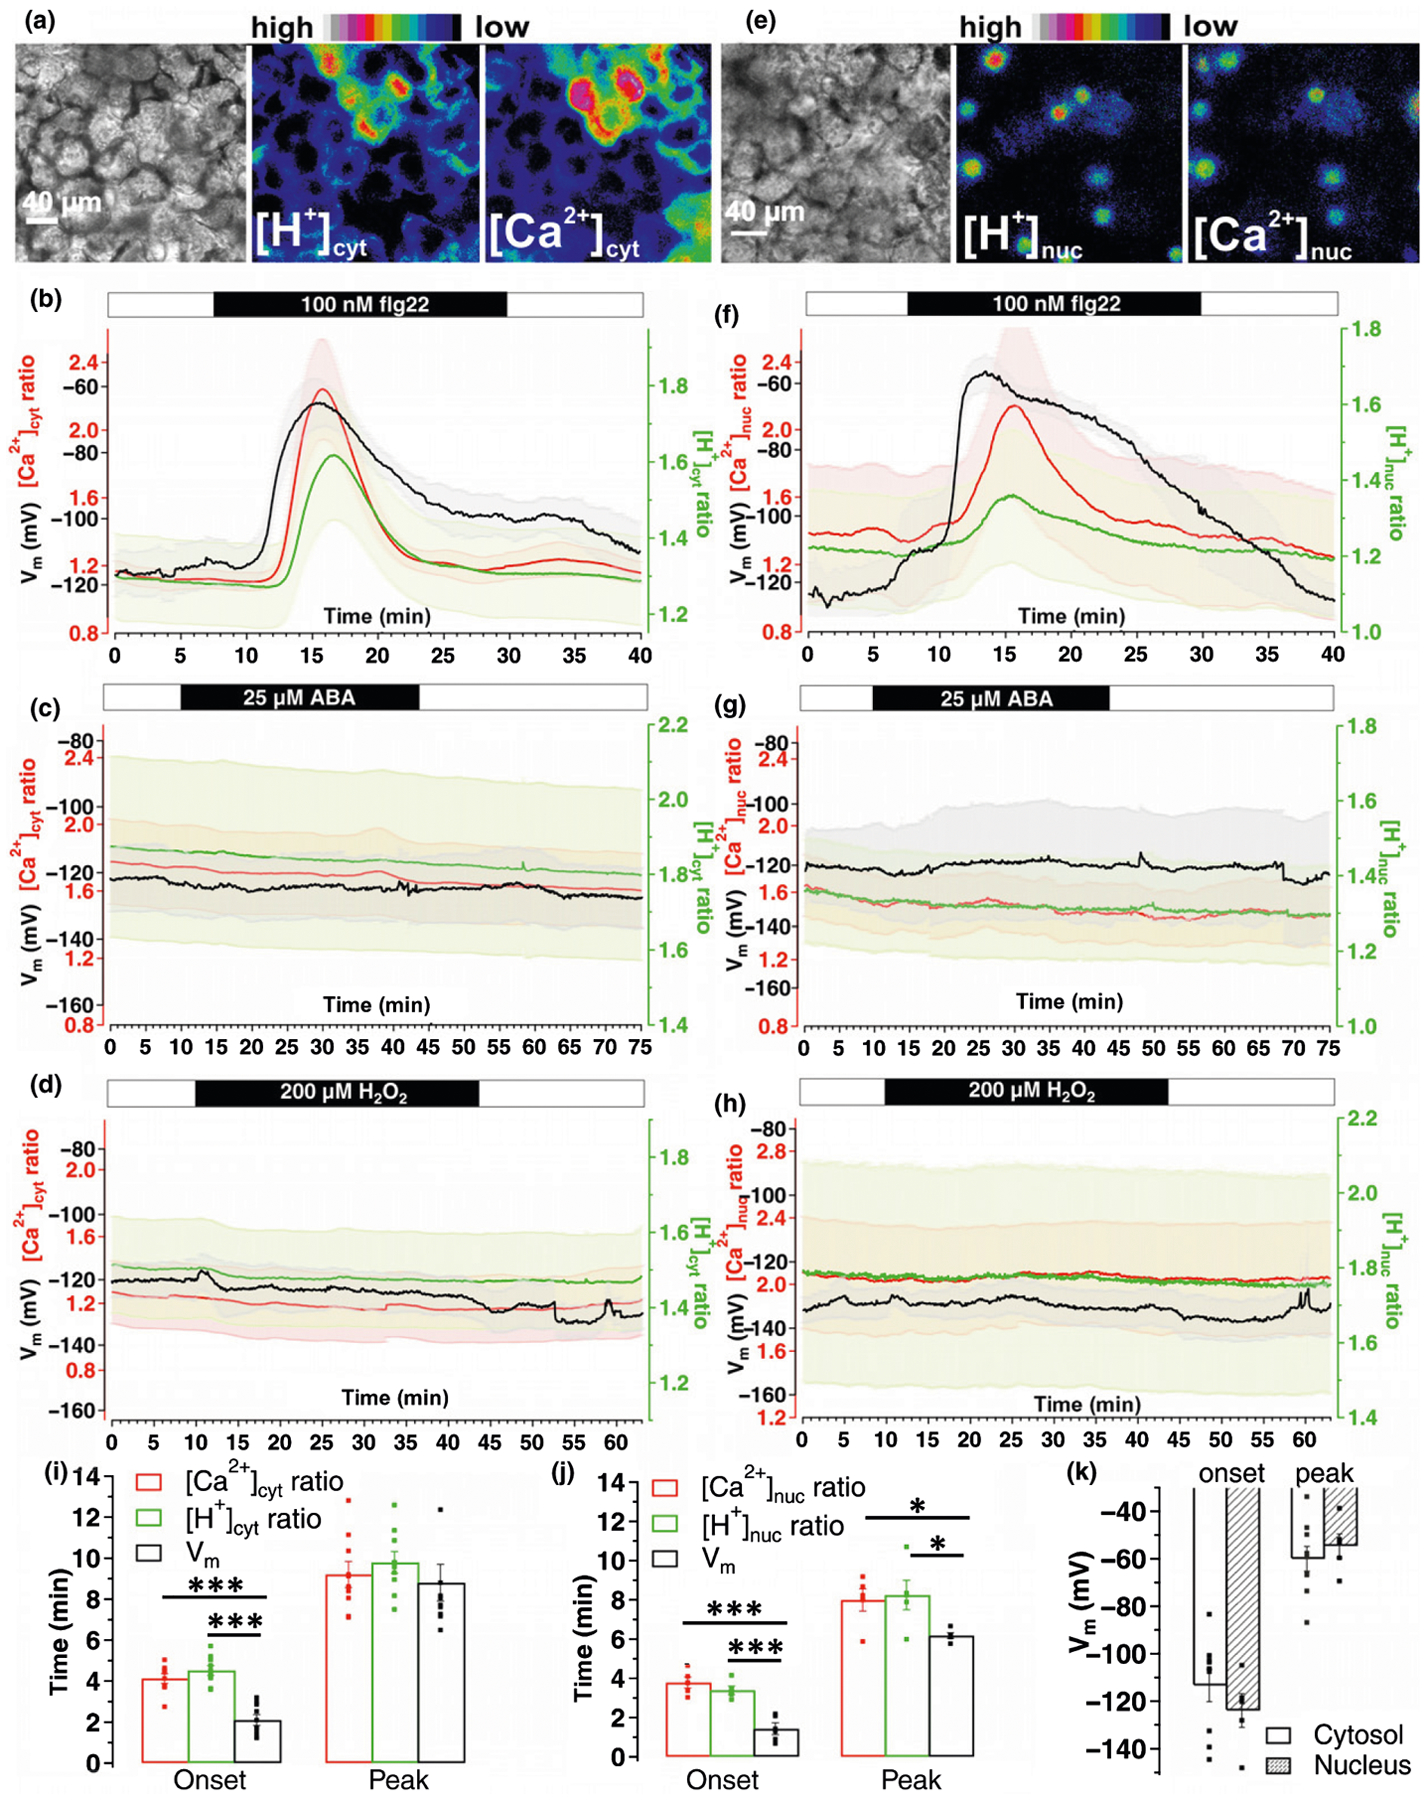
Distinct cytosolic and nuclear Ca2+- and H+-signatures in mesophyll cells upon different stimuli. Simultaneous Ca2+, H+ and Vm recordings in mesophyll cells of Nicotiana benthamiana leaves transiently expressing a cytosolic or nuclear version of the CapHensor. (a, e) Representative brightfield (left) as well as false colored [H+]- (middle) and [Ca2+] (right) ratio images of a leave mesophyll section expressing the (a) cytosolic- or (e) nuclear CapHensor version. (b–d) Mean [Ca2+]cyt ratio (red), [H+]cyt ratio (green) and membrane potential (Vm, black) dynamics over time upon application of (b) 100 nM flg22 (n = 9), (c) 25 μM ABA (n = 6) and (d) 200 μM H2O2 (n = 5). (f–h) Mean [Ca2+]nuc ratio (red), [H+]nuc ratio (green) and Vm (black) dynamics over time upon application of (f) 100 nM flg22 (n = 6), (g) 25 lM ABA (n = 4) and (h) 200 μM H2O2 (n = 5). (i, j) Bar diagram of mean onset and peak times of Ca2+ ratio (red), H+ ratio (green) and Vm after 100 nM flg22 with the cytosolic (i) or nuclear (j) expressed CapHensor. (k) Bar diagram of mean membrane potential (Vm) in mesophyll cells at the onset (left) and peak (right) response when the cytosol (blank, n = 9) or nucleus (shadow, n = 6) expressed version for CapHensor was used. Error bars = SE. Dots in (i–k) indicate individual measurements. One-way ANOVA was used in (i) and (j). *, P < 0.05; ***, P < 0.001.
