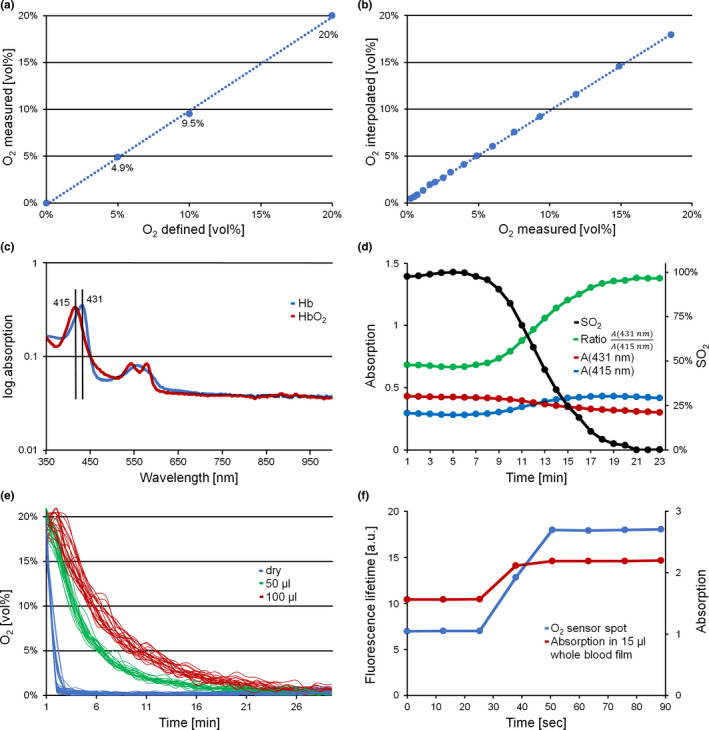
FIGURE 2.

Measurement conditions regarding determination of O2 and hemoglobin oxygen saturation with characterization of the respective response times. (a) Measured versus defined O2. Numbers in the graph refer to the measured values. (b) Linear interpolation of O2 (see Equation 3) as compared to measured O2, shown exemplarily for well G12. (c) Hb absorption spectra as measured in the blood films of the ODC plate. Red line HbO2, blue line Hb. Semilogarithmic presentation. (d) Absorption and calculated ratios during an ODC experiment shown exemplarily for well A6. Red (431 nm) and blue (415 nm) lines are raw absorption data, the green line is absorption ratio (431/415) and the black line oxygen saturation, SO2 (%). (e) O2 sensor readout under dry conditions and in various volumes of aqueous solutions (0.9% NaCl), measured in Oxoplate (see Supplemental Information). Gas supply (20% O2) was abruptly switched to 100% N2. Fast decrease under dry conditions (blue), delayed decrease in sensors submerged in a 50 µl fluid volume (green) and protracted response at 100 µl (red). (f) Response times of the O2 sensor spot under dry conditions (blue) and SO2 of a 15 µl whole blood film (red) at a steep ramp of O2 from 20% to 0% (switch to N2 at time 30 s). ODC, oxygen dissociation curve
