
FIGURE 3.
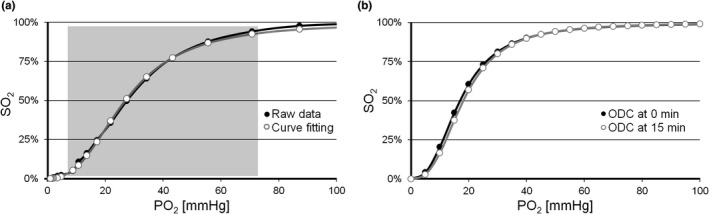
Raw data of ODC determination, regression analysis and shift of the ODC by pH change during ODC recording. (a) Raw data (black) and the ODC after curve fitting (white) by nonlinear regression analysis using the Hill function and least square method. The continuous Hill function was fitted using the data points between 5% and 95% SO2, as indicated by the shading. (b) Right‐shift in ODC (white) within 15 min compared to ODC at time zero (black), resulting in a calculated ΔpH of −0.05. ODC, oxygen dissociation curve