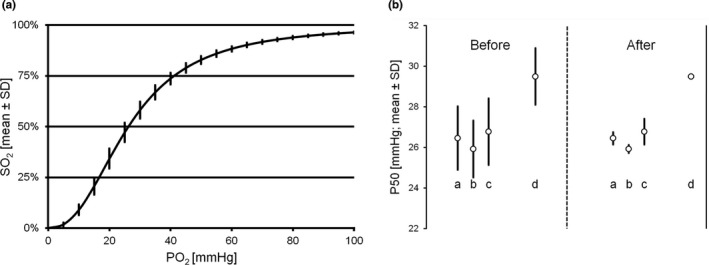
FIGURE 4.

Analysis of intra‐ and inter‐assay variability of the ODC method. (a) ODC intra‐assay variability (mean ± SD). Averaged ODC of a whole plate (n = 92). (b) ODC inter‐assay variability of three experiments with whole blood samples from three different persons (a, b, and c) and the internal standard solution (d) before and after correction with the internal standard solution. ODC, oxygen dissociation curve
