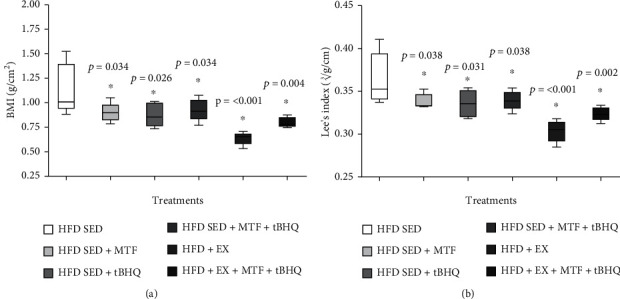
Figure 6.

BMI and Lee's index of HFD-treated groups. BMI (a) and Lee's index (b) plotted as mean and standard deviation evaluated in HFD-rats and the respective treatments at 14 months of age. The significant statistical differences between groups with respect to the HFD are marked with ∗. The exact probability value is indicated in the graph. The comparisons were established using ANOVA and a post hoc Holm-Sidak n = 5, ∗p < 0.05.
