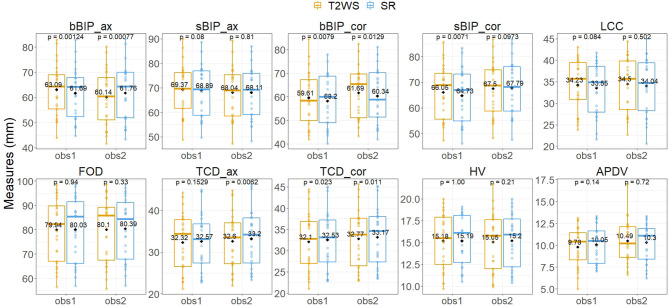
Figure 5.
Inter-dataset intra-observer comparison for each biometric measurement using the paired Wilcoxon signed rank test. Vertical y-axis, value in mm of each biometric measurement for each fetal brain exam (point) for observer 1 (obs1) and observer 2 (obs2) (horizontal x-axis) for T2-weighted sequence (T2WS; orange) and super-resolution (SR; blue). Solid horizontal lines depict the median; diamonds depict the average of measurement in mm. See Figure 3 for measurement abbreviations. p < 0.05 is considered significant.

