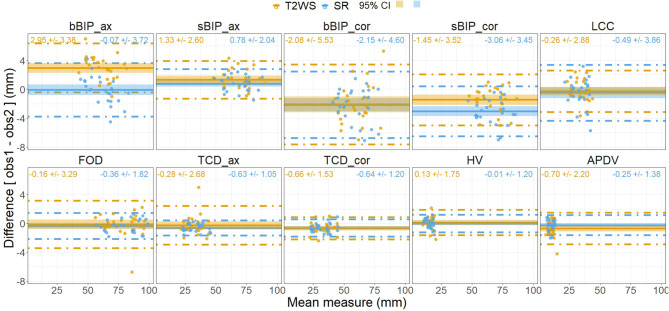
Figure 8.
Bland–Altman plots of measurement differences between observers (observer 1 vs. observer 2) for each dataset [intra-dataset, T2-weighted sequence (T2WS) and super-resolution (SR)] for each biometric measurement. Each point corresponds in the x-axis to the mean measure between observers and in the vertical y-axis to the difference in mm between the two observers on T2WS (orange point) and SR (blue point). Horizontal solid line = mean of all measurements for T2WS (blue) and SR (red); dashed lines = 95% limits of agreement, and shadow areas correspond to the 95% confidence interval (CI).

