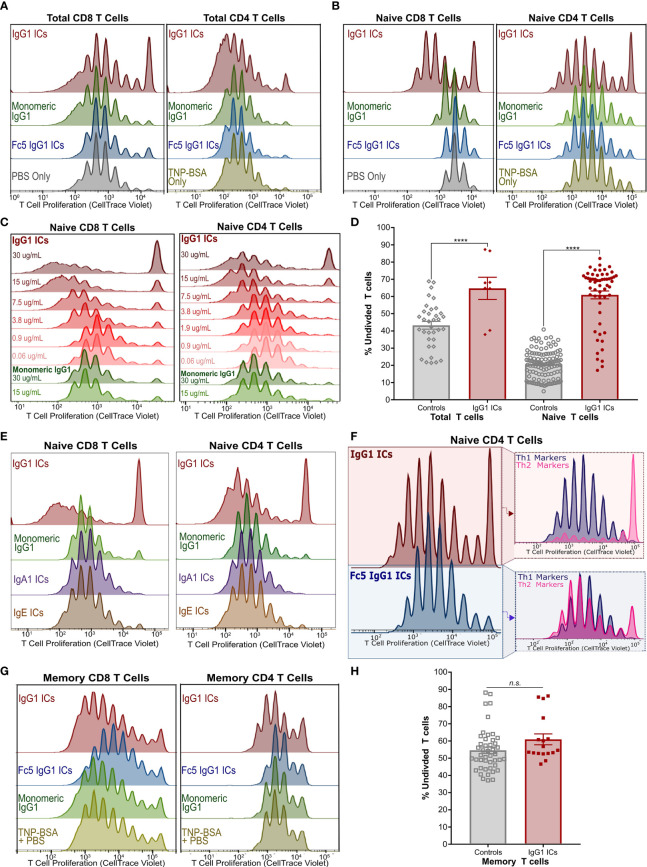
Figure 2.
IgG Immune Complexes Inhibit Naïve T Cell Proliferation but Stimulate a Subset of Their Progeny (A) Proliferation of activated CellTrace-stained Total CD8+ (left) and CD4+ (right) T cells incubated with IgG1-ICs or indicated controls (representative of 3 independent experiments/donors). (B) Proliferation experiment described in (A) with purified naïve CD8+ (left) and naïve CD4+ (right) T cells (representative of 8 independent experiments using 7 unique human donors for CD8+; 5 independent experiments/donors for CD4+). (C) Proliferation of activated naïve CD8+ and CD4+ T cells incubated with varying concentrations of IgG1-ICs (various shades of red) or monomeric IgG1 (green). (D) Summary of total and naïve T cell proliferation data (E) Proliferation experiments described in (A) with representative results for IgA1-ICs and IgE-ICs. (F) Activated naïve CD4+ T cells incubated with IgG1-ICs or Fc5 IgG1-ICs, cultured for 5-7 days, and stained with anti-CXCR3 and anti-CCR6 mAbs to examine Th1-like (CXCR3+ CCR6-) and Th2-like (CXCR3- CCR6-) phenotypes (representative of 4 independent experiments/donors). (G) Proliferation experiment described in (A) performed using enriched memory CD8+ T cells (representative of 3 independent experiments/donors for CD8+; 4 independent experiments/donors for CD4+). (H) Summary of memory T cell proliferation data. “****” indicates p-values < 0.0001 (one-way ANOVA). “n.s.” stands for statistically not significant. A tabulated summary of all proliferation experiments (N=26) for individual donors is provided in Table S2.

