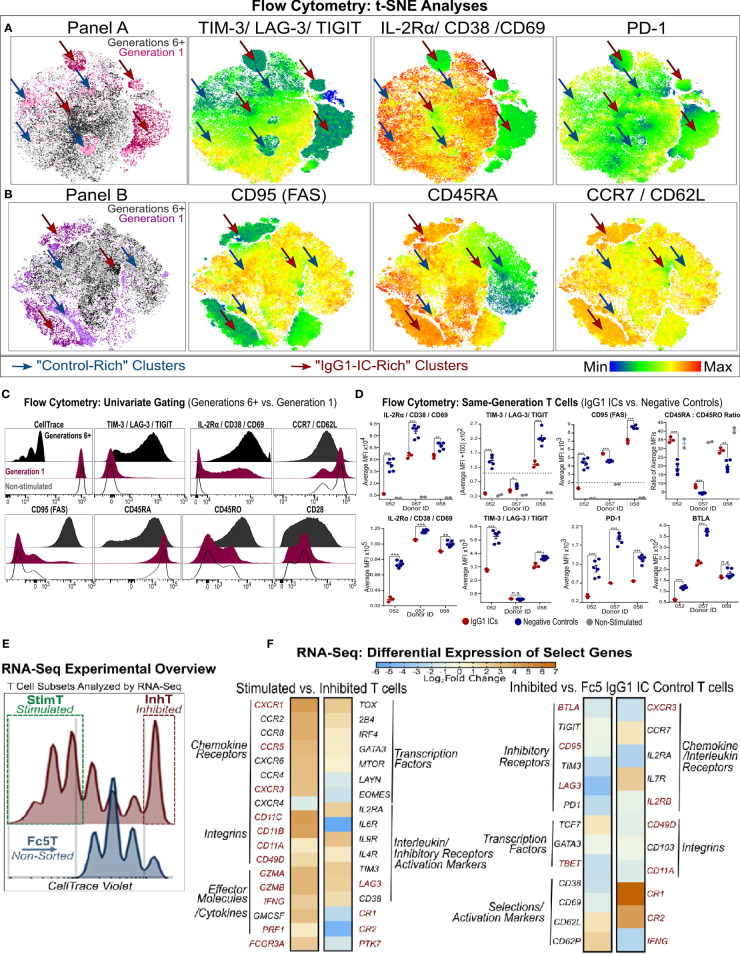
Figure 4.
Phenotypic Analysis of Inhibited and Stimulated T cell subsets Following Incubation with IgG1-ICs (A, B) t-distributed Stochastic Neighbor Embedding (tSNE) analysis of multi-color flow cytometry panels of activated naïve T cells incubated with IgG1-ICs or controls (Fc5 IgG1-ICs, monomeric IgG1, or TNP-BSA only). Naïve T cells were sampled equally across all controls and donors (N = 3 donors; 2 naïve CD8+ and 1 naïve CD4+). Red and blue arrows are visual aids pointing to “IgG1-IC-rich” or “control-rich” clusters, respectively. Gen1 and Gen6+ populations represent T cells that have not divided or divided at least 5 times, respectively. Gen1 T cells from samples incubated with or without IgG1-ICs are shown in dark and light pink/purple (Panel A/B), respectively. Gen6+ T cells from samples incubated with or without IgG1-ICs are dark and light grey, respectively. Heat-map t-SNE plots are shown for (i) TIGIT, TIM-3, and LAG-3 combination (i.e. TIGIT/TIM3/LAG3 lump gate) (ii) CD25, CD38, and CD69 (i.e. CD25/CD38/CD69 lump gate) and (iii) PD-1 stain. (iv) CD95 (v) CD45RA and (vi) CCR7 and CD62L (i.e. CCR7/CD62L lump gate). Staining for other markers and/or non-stimulated naïve T cells is shown in Figure S8. (C) Univariate plots for select markers from (A, B) are shown. The black and fuchsia histograms represent Gen6+ and Gen1 T cells regardless of treatment (IgG1-ICs and controls). Unfilled histograms pertain to cultured, non-stimulated T cells. (D) Average MFI (median fluorescence intensity) is shown specifically for Gen1 (top panels) and Gen6+ (bottom panels) T cells incubated either with IgG1-ICs (red) or controls (blue). Error bars represent the standard error of the mean (SEM). Asterisks *, **, and *** indicate p-values < 0.05, p-values < 0.01, and p-values < 0.0001, respectively. Values below the dashed lines are negative (common, unavoidable consequence of compensation) (E) Schematic overview of T cell populations analyzed by RNA-Seq (activated naïve CD8+ T cells incubated with either IgG1-ICs or Fc5 IgG1-ICs). IgG1 IC-treated T cells were sorted for cells stimulated by IgG1-ICs (StimT) and those inhibited by IgG1-ICs (InhT). Fc5 IgG1-IC-treated T cells (Fc5T) are not sorted. (F) Differential expression of select genes across StimT, InhT, and Fc5T. Genes are differentially expressed if the adjusted p-value < 0.05 and fold change (FC) ≥ 1.5 in either direction. Select DEGs mentioned in-text are in red. Other genes discussed in-text are shown in Table S4.

