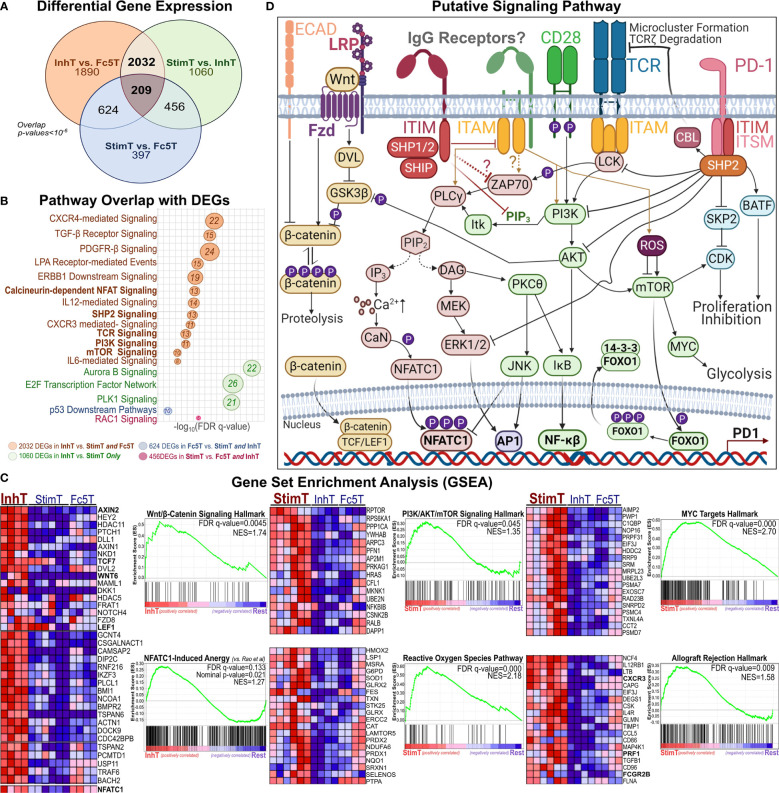
Figure 5.
Pathways Perturbed by IgG1 ICs Implicate SHP2, β-Catenin, and AKT/mTOR Signaling (A) Venn diagram showing the overlap of differentially expressed genes (DEGs) among StimT, InhT, and Fc5T. Genes are differentially expressed if the adjusted p-value < 0.05 and fold change ≥ 1.5 in either direction (B) bubble plot listing select pathways overlapping with observed DEGs. Bubble size is proportional to overlapping number of DEGs. x-axis represents -log(FDR-adjusted q-value) (C) Gene set enrichment analysis (GSEA); “Rest” represents any two of InhT, Fc5T, or StimT. For example, “InhT vs. Rest” compares InhT to both StimT and Fc5T. The y-axis shows the enrichment score (ES) for members of the gene set. The top portion of the plot shows the running ES for the gene set as the analysis walks down the ranked list of genes. The middle portion of the plot shows where the members of the gene set appear in the ranked list of genes. FDR q-value and the normalized enrichment score (NES) are shown. As recommended by GSEA for non-pre-ranked RNA-Seq, gene sets are considered significantly enriched if the FDR-q value < 0.25. Heatmaps represent select genes contributing to enrichment. By default, GSEA expression values are represented as a range of colors, where red, pink, light blue, and dark blue represent high, moderate, low, lowest expression, respectively. Other enriched pathways are shown in Table S6 (D) Putative signaling network hypothesizing how an IgG1 receptor may theoretically perturb other established T cell pathways.

