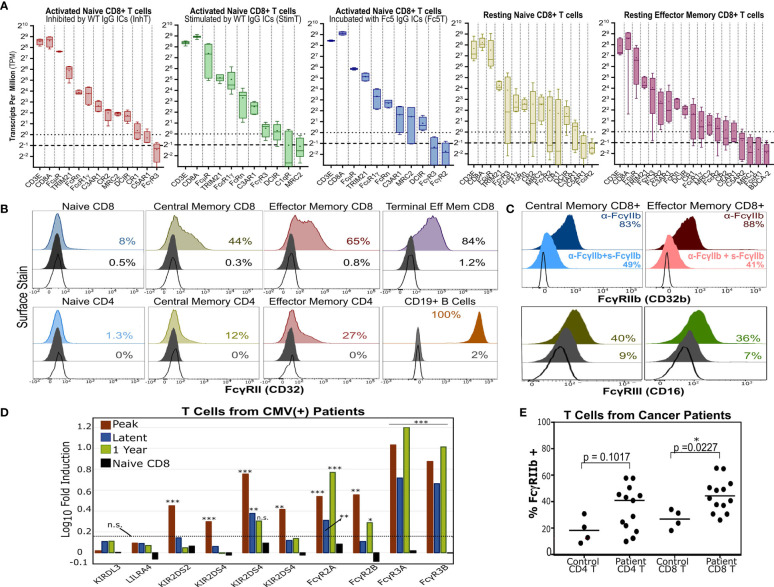
Figure 6.
T Cells Express Multiple Antibody Receptors. (A) mRNA of lectins and several antibody receptors in various T cell subsets. Results for “resting” subsets derive from RNA-Seq data published by Ranzani et al. (48) and pertain to sorted, non-stimulated cells (4-5 donors). The median (line), mean (dot), minimum/maximum(whiskers), and interquartile range (box) are shown. The dotted and dashed lines represent the TPM=1 (expressed) and TPM=0.5 (very low expression) thresholds. TPMs for CD3E and CD8A are shown for reference. (B) Surface expression of FcγRII (CD32) in various unstimulated T cell subsets. B cells serve as a positive control. (C) FcγRIIb or FcγRIII surface expression in memory CD8+ T cells. For FcγRIIb, T cells were stained with an aglycosylated FcγRIIb antibody with or without competing soluble, non fluorescent FcγRIIb. (B, C) Dark gray and unfilled histograms represent isotype controls and non stained cells, respectively. Displayed percentages correspond to % positive events set relative to unstained cells. (D) Differential FcγR gene expression in CD8+ T cells of HCMV-infected patients (vs. healthy donor CD8+ T cells). Results derive from microarray RNA data published by Van Stijn et al. (39). Various timepoints post-infection are shown (3 patients; 3 healthy donors). Non-FcγR genes considered differentially expressed or unchanged by Van Stijn et al. are shown. Asterisks *, **, and *** represent p-values <0.05, p-values <0.01, and p-values < 0.001, respectively. n.s. stands for statistically not significant. The dashed line denotes the fold induction threshold below which no statistical significance was observed. (E) FcγRIIb display in T cells isolated from PBMCs of healthy donors or cancer patients. The percent of FcγRIIb(+) events is determined based on the FMO gate.

