Figure 5.
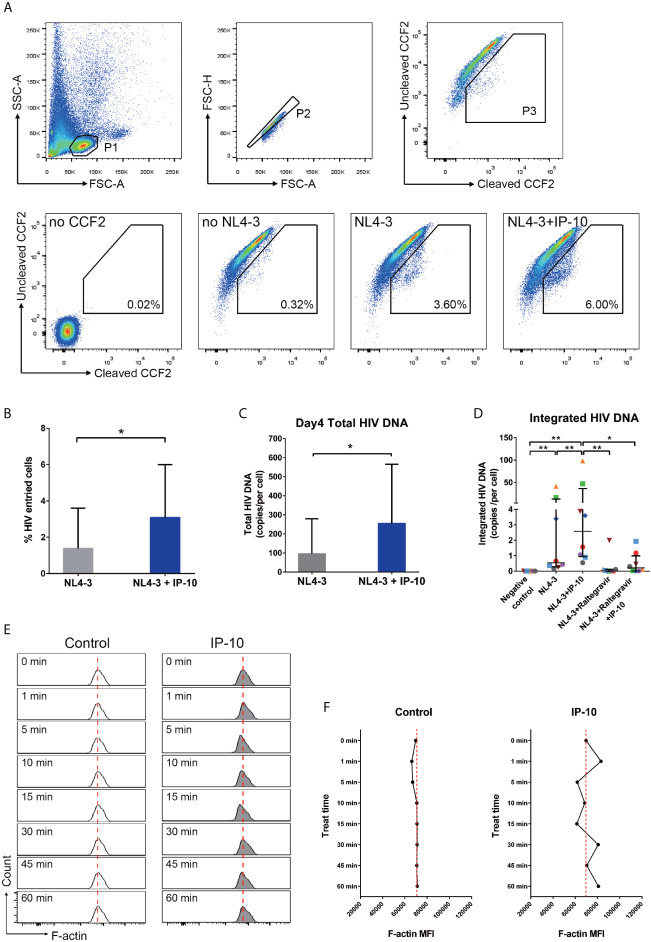
IP-10 promotes HIV NL4-3 entry into resting memory CD4+ T cells, viral DNA synthesis and integration, and actin activation. (A) Gating strategy and representative flow cytometry plots from the experiment evaluating the role of IP-10 in the infection of resting memory CD4+ T cells by HIV NL4-3. Viral entry into resting memory CD4+ T cells was evaluated with the BlaM-Vpr entry assay. For no CCF2, cells were pretreated for 1 h with IP-10 (5 ng/ml) and then infected with NL4-3. For no NL4-3, cells were treated with CCF2 without NL4-3 infection. For NL4-3, cells were treated with CCF2 before infection with NL4-3. For NL4-3+IP-10, cells were treated with CCF2 before pretreatment for 1 h with IP-10 (5 ng/ml), and then infected with NL4-3. The Wilcoxon matched-pairs test was used to compare median values between two groups (N=7, P=0.016). (B) Quantification of HIV+ cells in NL4-3 and NL4-3+IP-10 groups. The Wilcoxon matched-pairs test was used to compare median values between groups. (C) For NL4-3, cells were infected with NL4-3; for NL4-3+IP-10, cells were pretreated for 1 h with IP-10 (5 ng/ml) and then infected with NL4-3. Cells were infected for 2 h, washed, and then collected at different time points for ddPCR quantification of total viral DNA at 4 days. Results are expressed as copies/cell. The Wilcoxon matched-pairs test was used to compare median values between groups (N=6, P=0.031). (D) Quantitative (Alu) PCR analysis of HIV DNA integration in negative control, NL4-3, NL4-3+IP-10, NL4-3+raltegravir, and NL4-3+raltegravir+IP-10 groups. As the variances are different, the Wilcoxon matched-pairs test was used to compare median values between groups (N=8, NL4-3 vs. NC: P=0.008; NL4-3+IP-10 vs. NC: P=0.008; NL4-3+IP-10 vs. NL4-3: P=0.008; NL4-3+Raltegravir vs. NL4-3+IP-10: P=0.008; NL4-3+Raltegravir +IP-10 vs. NL4-3+IP-10: P=0.039; NL4-3+Raltegravir vs. NC: P=0.062; NL4-3+Raltegravir +IP-10 vs. NC: P=0.016; NL4-3+Raltegravir vs. NL4-3: P=0.078; NL4-3+Raltegravir+IP-10 vs. NL4-3+Raltegravir: P=0.469). (E) Representative flow cytometry plots from the experiment evaluating the effect of IP-10 on actin polymerization and depolymerization over time. The red dashed line represents localized baseline unstimulated F-actin level. (F) Temporal profile of MFI in control and IP-10–treated resting memory CD4+ T cells (The result for one of the three separated experiments is showed in the figure). *P < 0.05, **P < 0.01.

