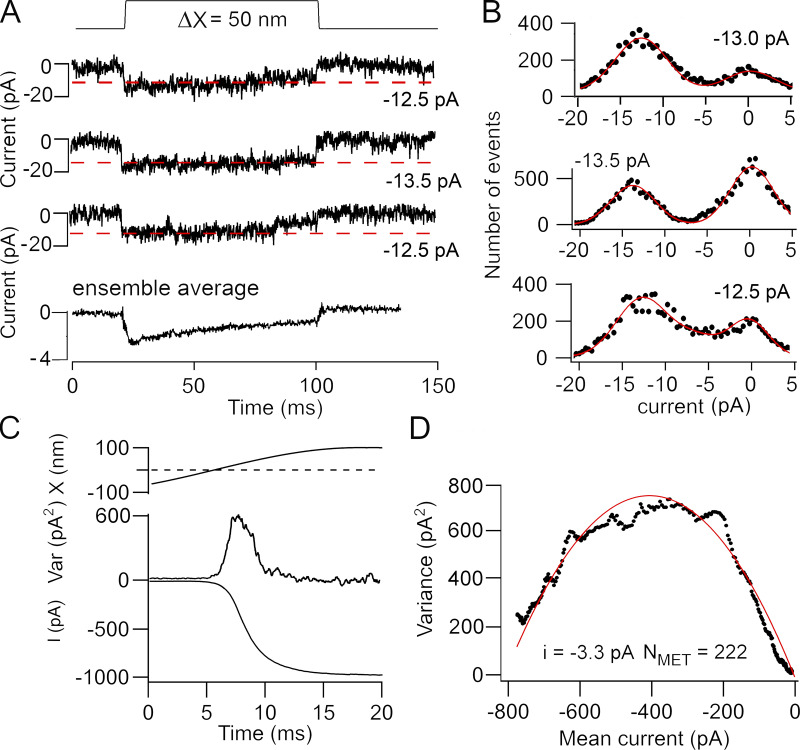
Figure 3.
Comparison of noise analysis and single-channel events in a P3 basal OHC of a Tmc1+/+; Tmc2−/− mouse. (A) Examples of three channel events for bundle deflections and the ensemble average of 50 stimuli shown below. The decline in the ensemble average with time is a manifestation of channel adaptation as previously observed (Ricci et al., 2003). Dashed red lines correspond to best estimate of channel size. (B) Amplitude histograms of the three recordings in A, with two Gaussian fits with peak currents denoted on each panel. (C) Mean response to a half cycle of a 40-Hz bundle deflection showing the current (bottom) and the current variance (top). (D) Plot of variance against mean current fit with Eq. 1 to give single-channel current of −3.3 pA and NMET = 222 channels. Noise analysis was performed first, and BAPTA was then applied to obtain single-channel events. Holding potential, −84 mV. Var, variance.

