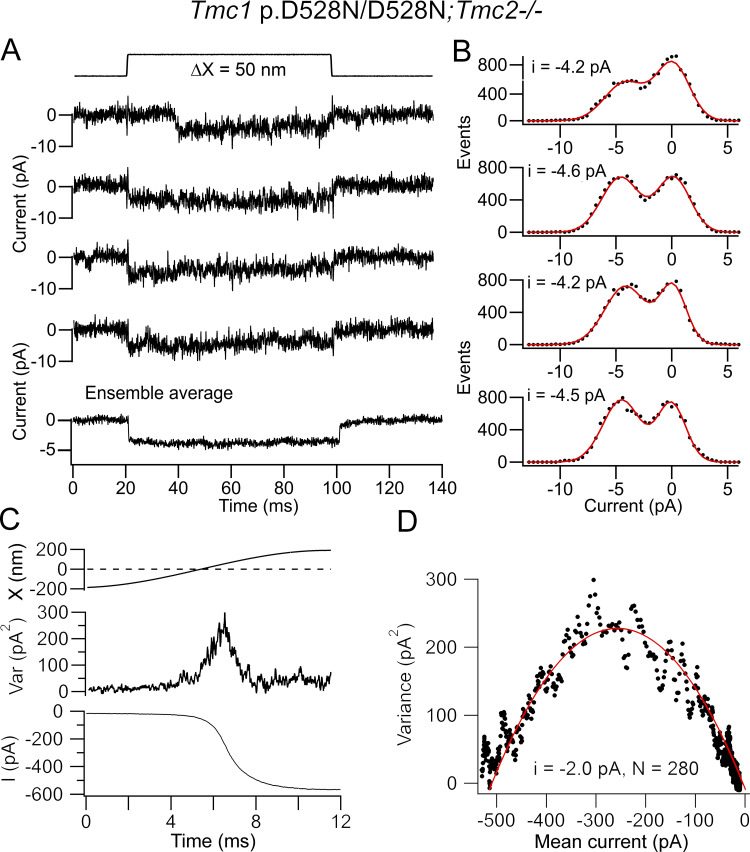
Figure 5.
Single channels in apical OHCs of Tmc1 p.D528N/D528N; Tmc2−/− P5 mice. (A) Four single-channel events for bundle deflection (top) with ensemble average of 35 presentations (bottom). (B) Amplitude histograms of the recordings in A, with two Gaussian fits giving peak currents of −4.2 to −4.6 pA. (C) Response to a half cycle of bundle deflection showing the mean current I (bottom) and current variance (top). (D) Variance plotted against mean current, with smooth red line fit with Eq. 1 (i = −2.0 pA and NMET = 280 channels). Channel events and noise analysis from different OHCs. Holding potential, −84 mV. Var, variance.

