Figure 8.
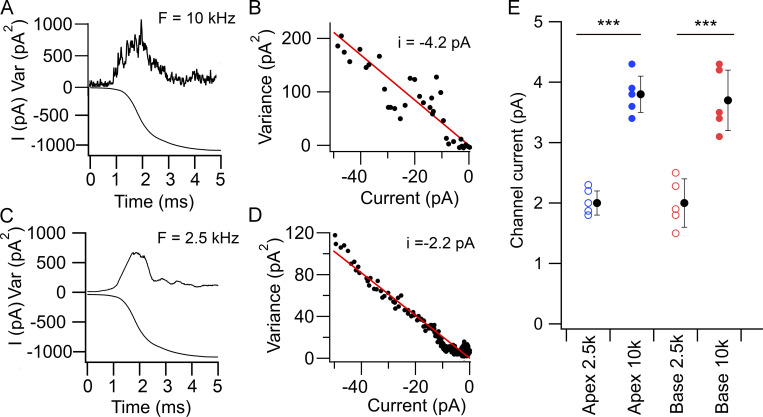
Effects of filtering on noise-derived MET single-channel currents. (A) Response to a half cycle of bundle deflection recorded with a 10-kHz low-pass filter showing the current variance (top) and the mean current (bottom) for 45 presentations. (B) Plot of variance against mean current for small stimuli; linear fit gave i = −4.2 pA. (C) Response to a half cycle of bundle deflection recorded with a 2.5-kHz low-pass filter for the same cell as A showing the current variance (top) and the mean current (bottom) for 45 presentations. (D) Plot of variance against mean current for records in C; linear fit gave i = −2.2 pA. Note that the 2.5-kHz filter smoothed the variance and reduced the apparent unitary conductance. All measurements on a P5 mouse. (E) Collected results of apparent channel current for five apical OHCs filtered at 10 kHz (filled blue circles) and 2.5 kHz (open blue circles) and for five basal OHCs filtered at 10 kHz (filled red circles) and 2.5 kHz (open red circles); filled black circles give mean ± SD. ***, P = 0.0006 by paired t test. There was no significant difference between the means for apical and basal results at 2.5 or 10 kHz. In all panels, holding potential, −84 mV. Var, variance.

