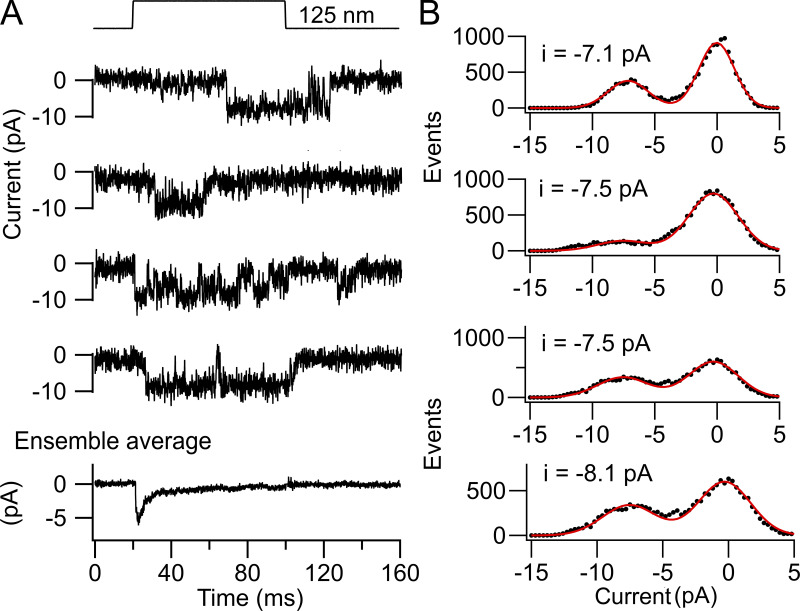
Figure 9.
MET channels recorded in an apical OHC from a P2 Tmc1+/+; Tmc2−/− neonatal mouse without use of BAPTA. (A) Four single-channel traces and an ensemble average in response to bundle deflection shown at the top. (B) Amplitude histograms of the traces in A. The mean channel amplitude was −7.4 ± 0.6 pA from 49 traces. Holding potential, −84 mV.

