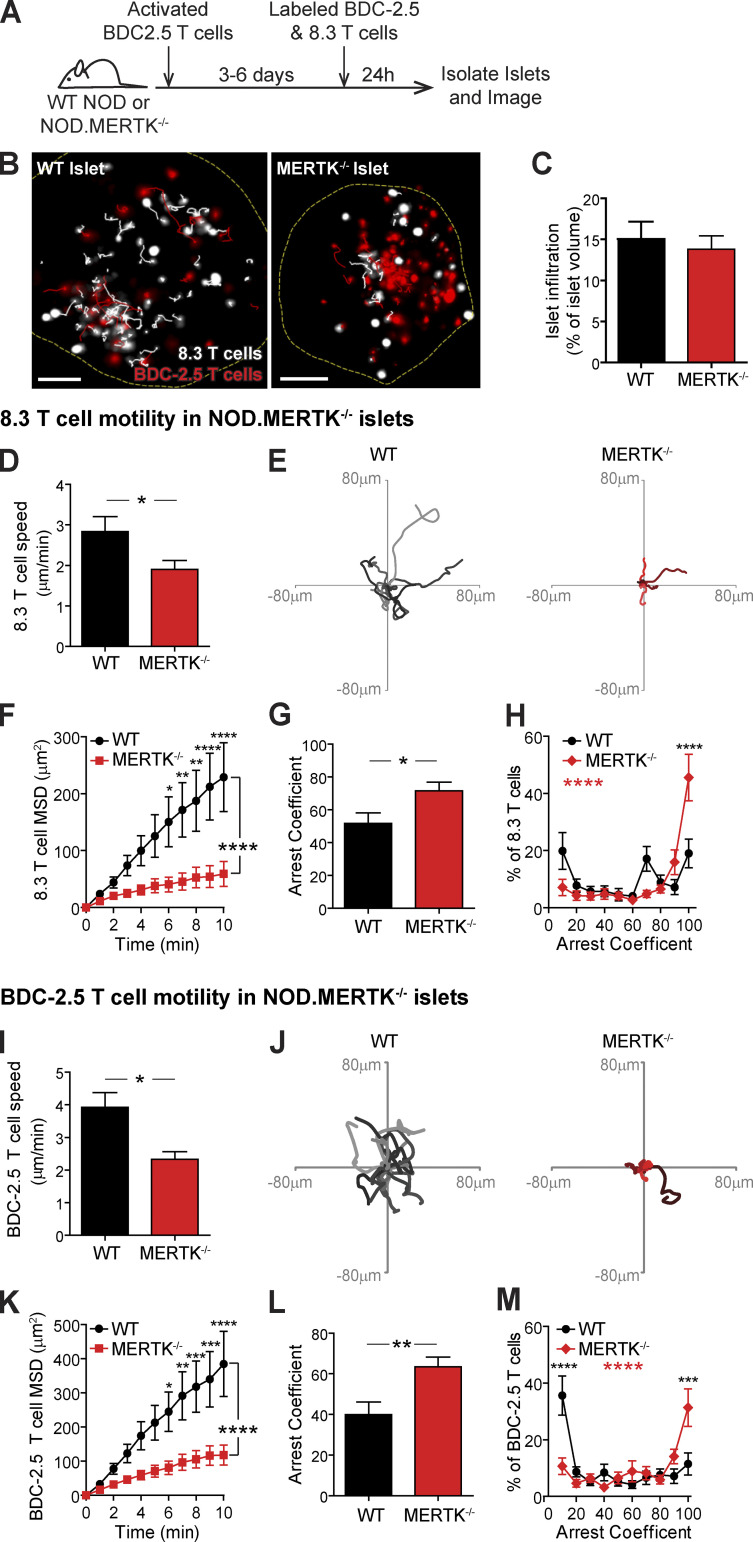
Figure 3.
Islet-antigen–specific T cells in MERTK−/− islets show decreased motility and increased T cell arrest. Activated BDC-2.5 CD4 T cells were transferred into NOD or NOD.MERTK−/− female mice to initiate islet infiltration. Fluorescently labeled activated 8.3 CD8 and BDC-2.5 CD4 T cells were then transferred into the same mice 3–6 d later. 24 h after fluorescent T cell transfer, islets were isolated and analyzed by two-photon microscopy. (A) Schematic of experimental setup. (B) Representative islet images from WT NOD or NOD.MERTK−/− mice with 10-min tracks of motion. Dashed line depicts islet border. 8.3 CD8 T cells are shown in white, and BDC-2.5 CD4 T cells are shown in red. Scale bars, 50 µm. (C) Average level of islet infiltration. (D and I) Average T cell crawling speed per islet. (E and J) Example of representative 15-min tracks of motion of 15 T cells from representative islets. (F and K) MSD over time, averaged per islet. (G, H, L, and M) Arrest coefficient: percentage of time that a cell crawls <1.5 µm/min, averaged per islet. (C–M) Data are pooled from four or five independent experiments. Error bars represent SEM. (D–H) n = 22 WT islets containing 864 analyzed 8.3 T cells and n = 23 MERTK−/− islets containing 893 analyzed 8.3 T cells. (I–M) n = 25 WT islets containing 1,069 analyzed BDC-2.5 T cells and n = 28 MERTK−/− islets containing 1496 analyzed BDC-2.5 T cells. (C, D, G, I, and L) Statistics: two-tailed Student’s t test. (F, H, K, and M) Statistics: two-way ANOVA with Bonferroni’s multiple comparison test, treatment effect (black statistic), interaction effect (red statistic). *, P < 0.05; **, P < 0.01; ***, P < 0.001; ****, P < 0.0001.

