Figure 7.
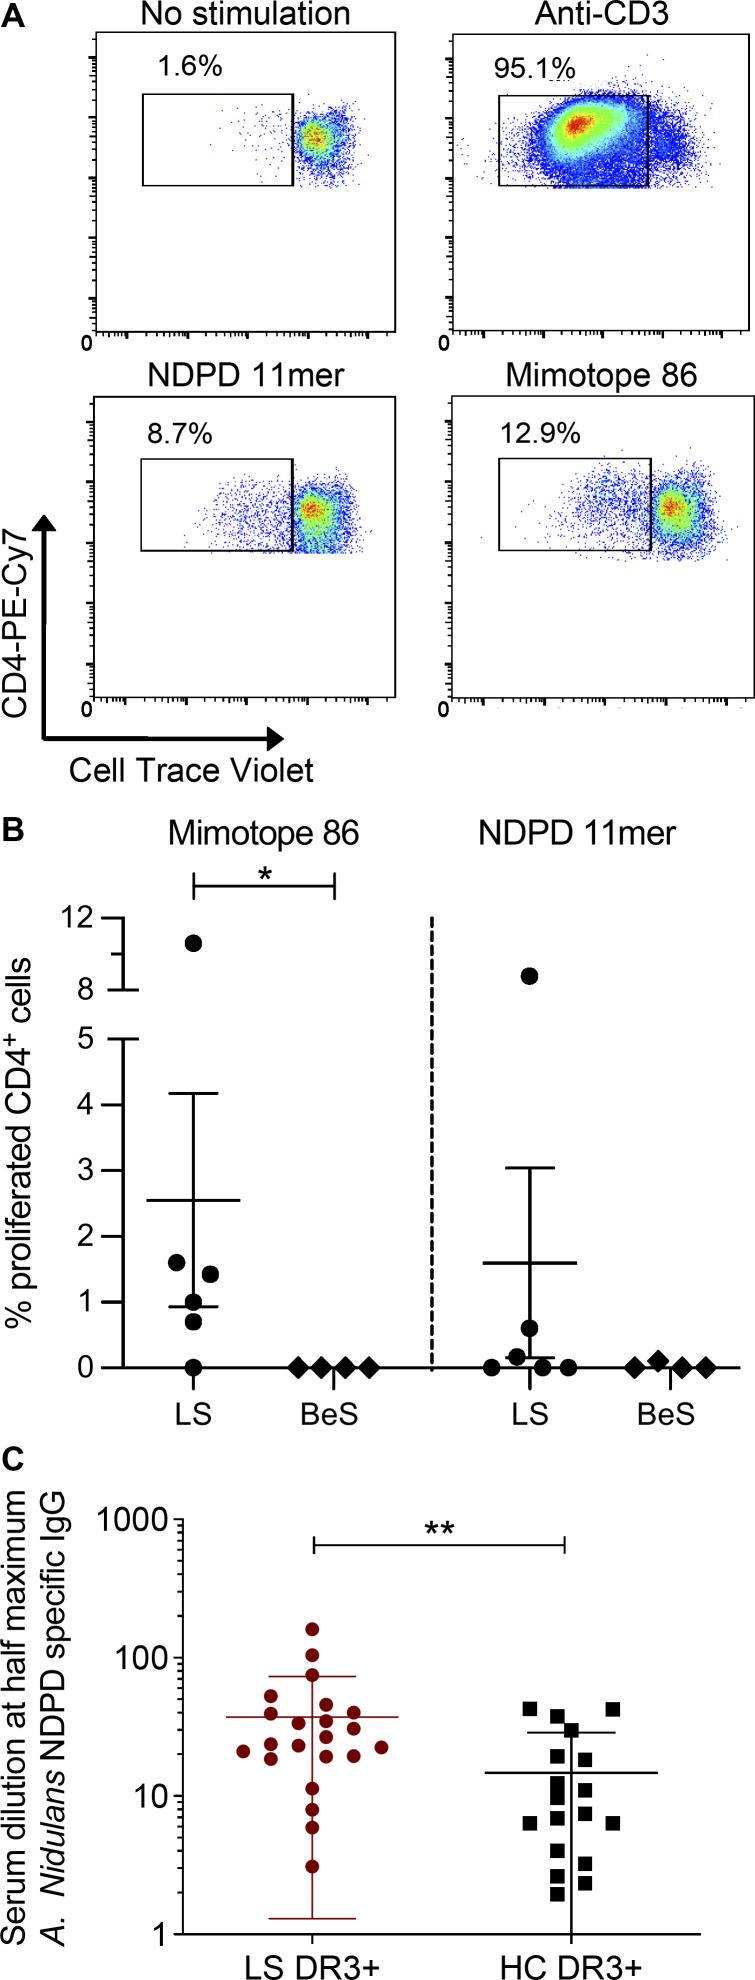
T cell proliferation and IgG specific for A. nidulans NDPD in the blood of DR3+ LS patients. (A) Representative density plots showing the frequency of proliferated CD4+ T cells (measured by loss of Cell Trace Violet) derived from blood of a DR3+ LS subject after stimulation with media alone, plate-bound anti-CD3 (10 μg/ml), 5 μg/ml A. nidulans NDPD peptide, or 5 μg/ml mimotope 86 peptide. (B) Summary of the frequency of CD4+ T cell proliferation in response to A. nidulans NDPD peptide or mimotope 86 peptide, after subtraction of background proliferation with no stimulation, in DR3+ LS (n = 6) and DR3+ BeS (n = 4) subjects. (C) Levels of IgG specific for A. nidulans NDPD were measured by ELISA in threefold serum dilutions (1–2,187) of HLA-DR3+ LS (n = 22) and HLA-DR3+ healthy control (HC) subjects (n = 18), and the serum dilution that elicited 50% of the maximum antibody response for each subject was determined using nonlinear regression curves. Statistical significance in B and C was determined by Mann-Whitney test. *, P < 0.05; **, P < 0.01.

