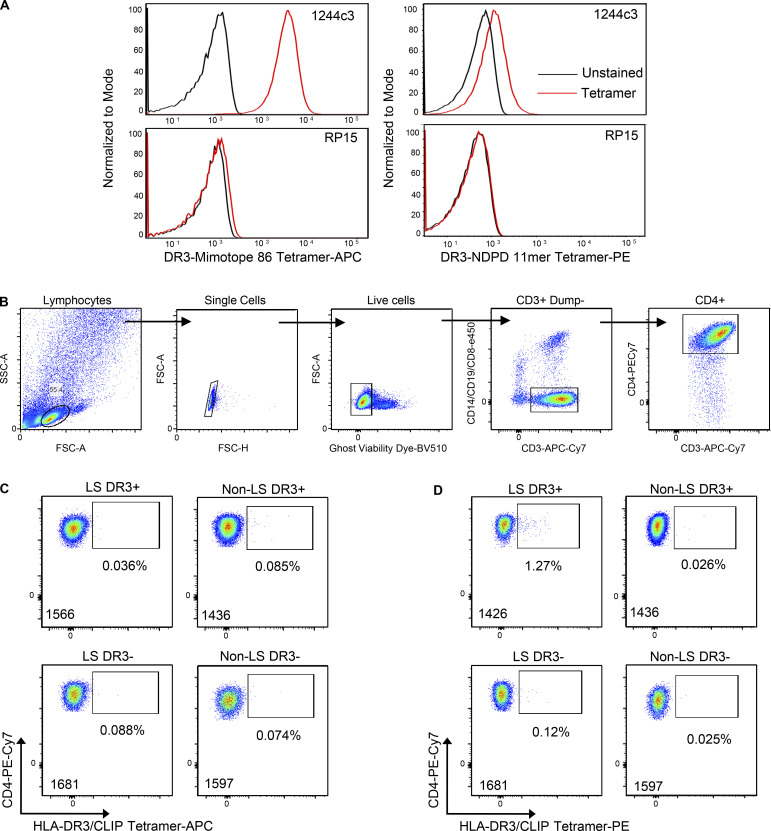
Figure S4.
HLA-DR3–peptide tetramer staining of LS-specific 1244 TCR-expressing hybridomas and ex vivo BAL cells. (A) Representative histograms of LS-specific 1244c3 and RP15 (specific for HLA-DR3 p3–p13 of hsp65 of M. leprae) T cell hybridoma staining with HLA-DR3–peptide tetramers (A. nidulans NDPD 11-mer, 1 μg/ml; mimotope 86, 10 μg/ml). (B) Representative density plots showing the gating strategy to isolate live CD4+ T cells from the BAL to analyze tetramer staining on CD4+ T cells. (C and D) Representative density plots of HLA-DR3–CLIP–APC (10 μg/ml; C) and HLA-DR3–CLIP–PE (1 μg/ml; D) tetramer staining of CD4+ T cells used to determine background frequencies of HLA-DR3–peptide tetramer–binding cells. The patient number is listed in the lower left corner of each density plot. FSC, forward scatter; SSC, side scatter.

