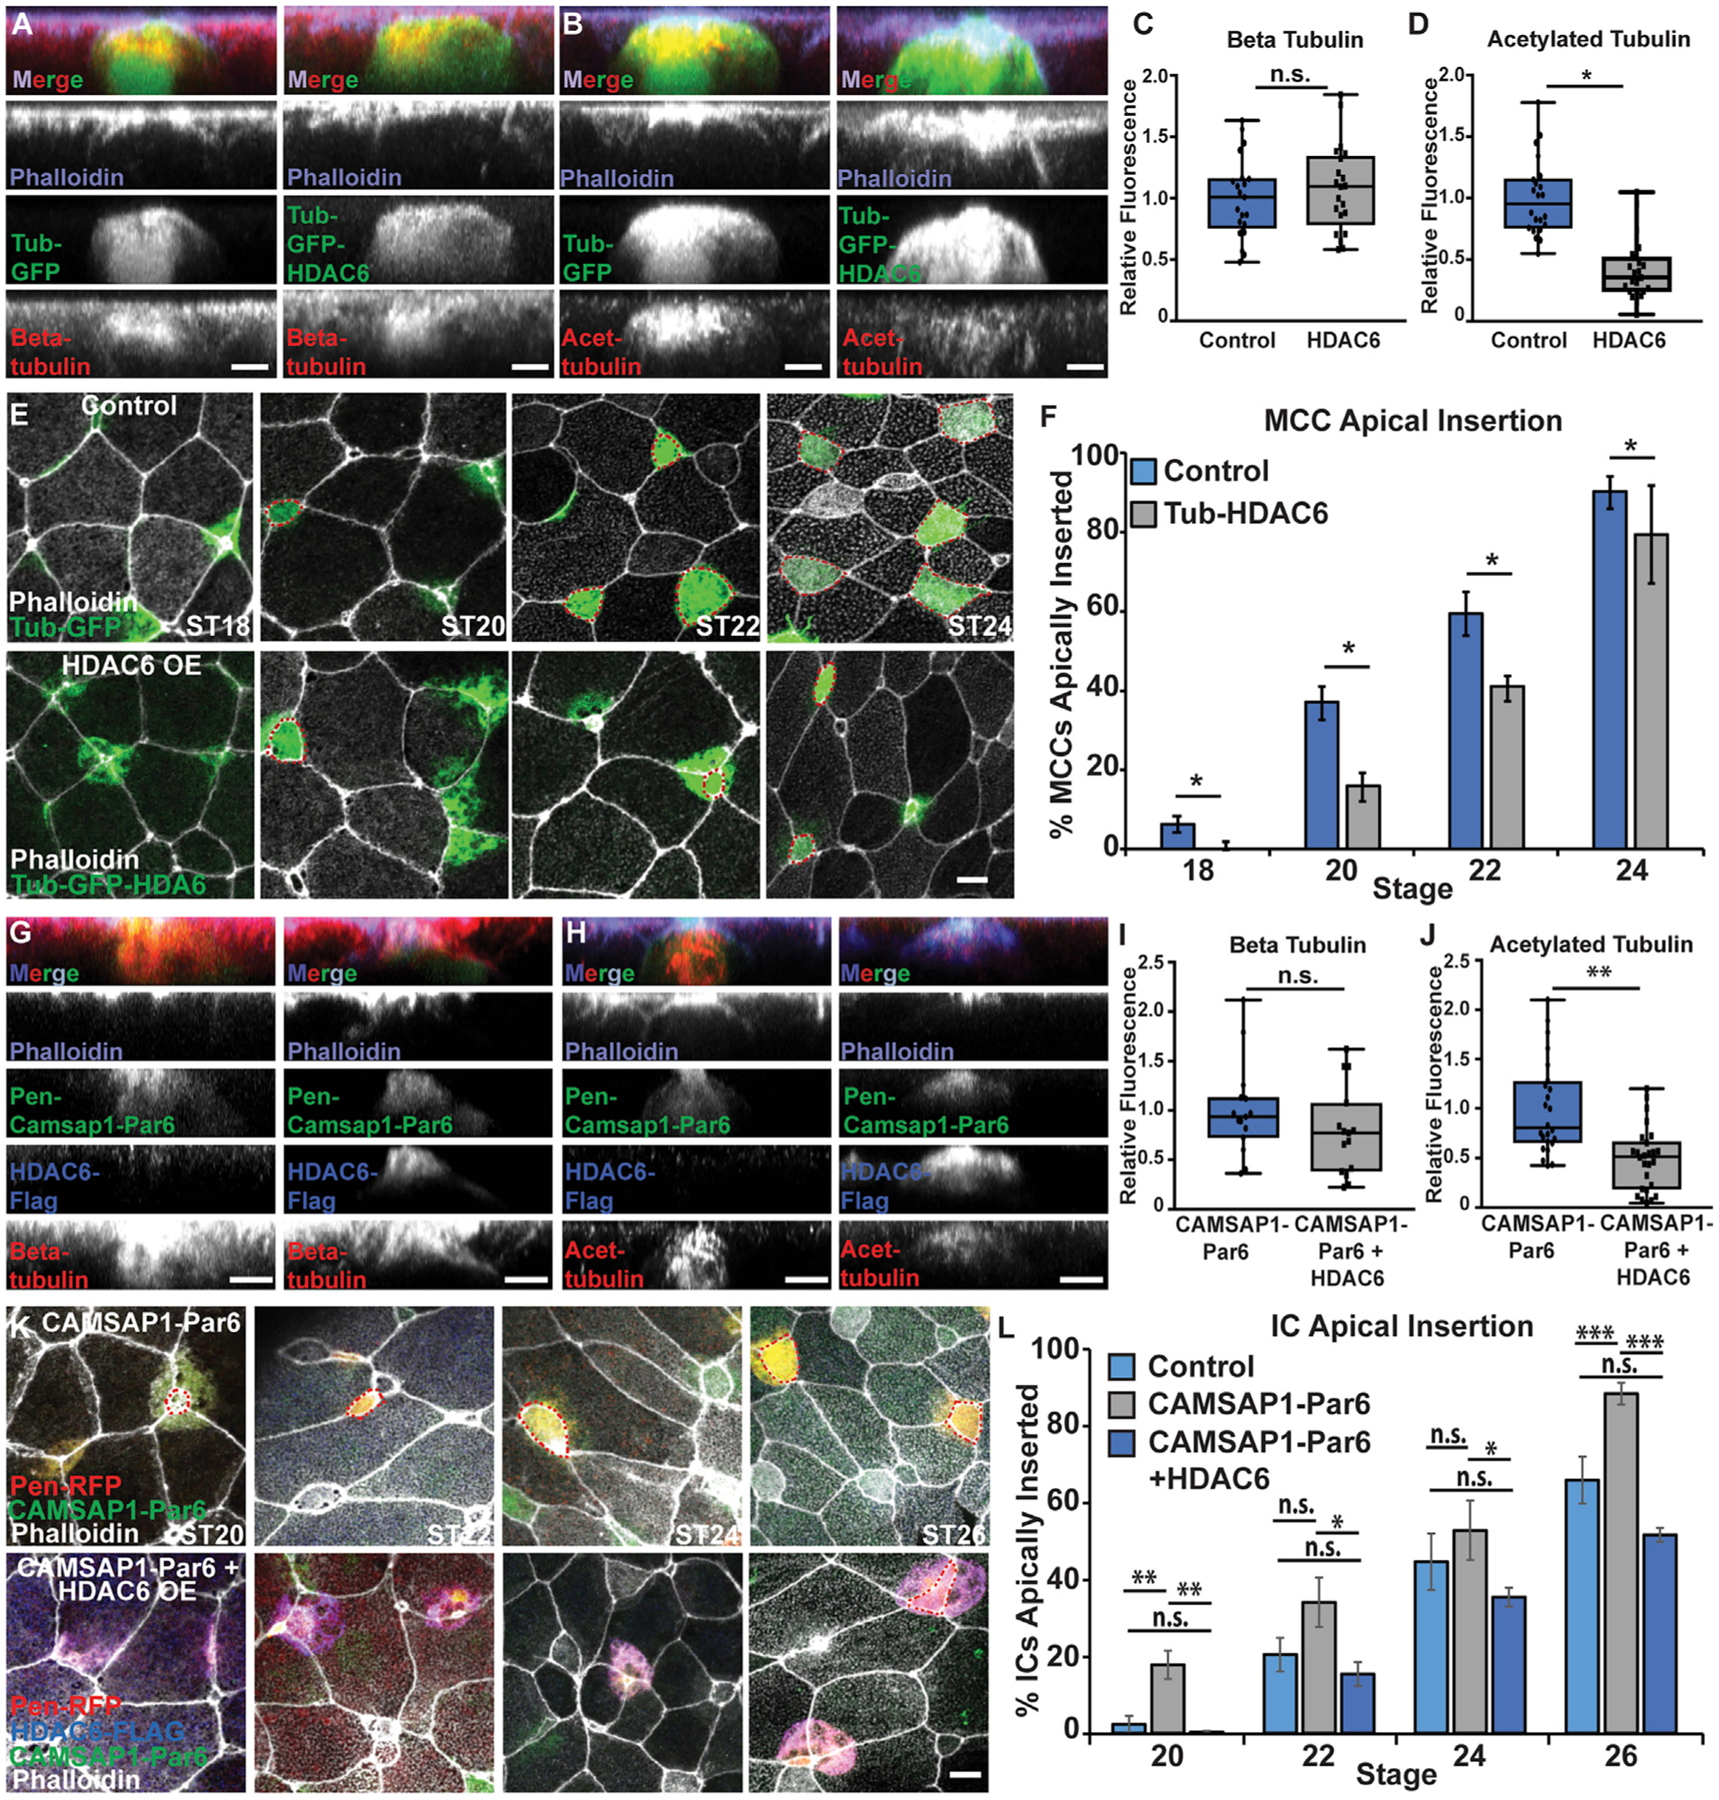
Figure 1. Loss of MT acetylation delays apical insertion.

(A and B) Side projections of intercalating control and Tub-GFP-HDAC6 OE MCCs fixed and stained with phalloidin and α-beta tub (A) or α-acetylated (α-acetyl.) tub. (B).
(C and D) Quantification of beta tub (C) and of acetyl. tub (D) in control and HDAC6 OE MCCs. Fluorescence was normalized relative to control (uninjected) MCCs in mosaic embryos for each experiment.
(E) Z-projections of embryos mosaically injected with Tub-GFP or Tub-GFP-HDAC6 DNA and phalloidin to assay apical insertion.
(F) Quantification of the percentage of MCCs apically inserted at each stage.
(G and H) Side projections of intercalating Pen-CAMSAP1-Par6 and Pen-CAMSAP1-Par6 + HDAC6 OE ICs stained with α-FLAG, phalloidin, and α-beta tub (G) or α-acetyl. tub (H).
(I and J) Quantification of beta tub (I) or acetyl. tub (J) in CAMSAP1-Par6 and CAMSAP1-Par6 + HDAC6 OE ICs. Fluorescence was normalized relative to (control) ICs expressing only CAMSAP1-Par6 in mosaic embryos for each experiment.
(K) Z-projections of embryos mosaically injected with Pen-RFP and HDAC6-FLAG DNA and CAMSAP1-Par6 mRNA and stained with α-FLAG and phalloidin to assay apical insertion.
(L) Quantification of the percentage of ICs apically inserted at each stage.
For all bar graphs (F and L), bars represent the average and error bars indicate SD; for all box-and-whisker plots (C, D, I, and J), the box represents 25%–75% range, the line is the median, and the whiskers represent the total change; and *p < 0.05, **p < 0.01, ***p < 0.001.
Analysis includes n > 80 cells from at least 6 embryos per condition (C), n > 60 cells from at least 5 embryos per condition (D), n > 175 cells from at least 9 embryos per condition and ST (F), n > 15 cells from at least 5 embryos per condition (I), n > 25 cells from at least 7 embryos per condition (J), and n > 50 cells from at least 9 embryos per condition/time point (L). Scale bars in (A), (B), (G), and (H) represent 5 μm and in (E) and (K) represent 10 μm.
