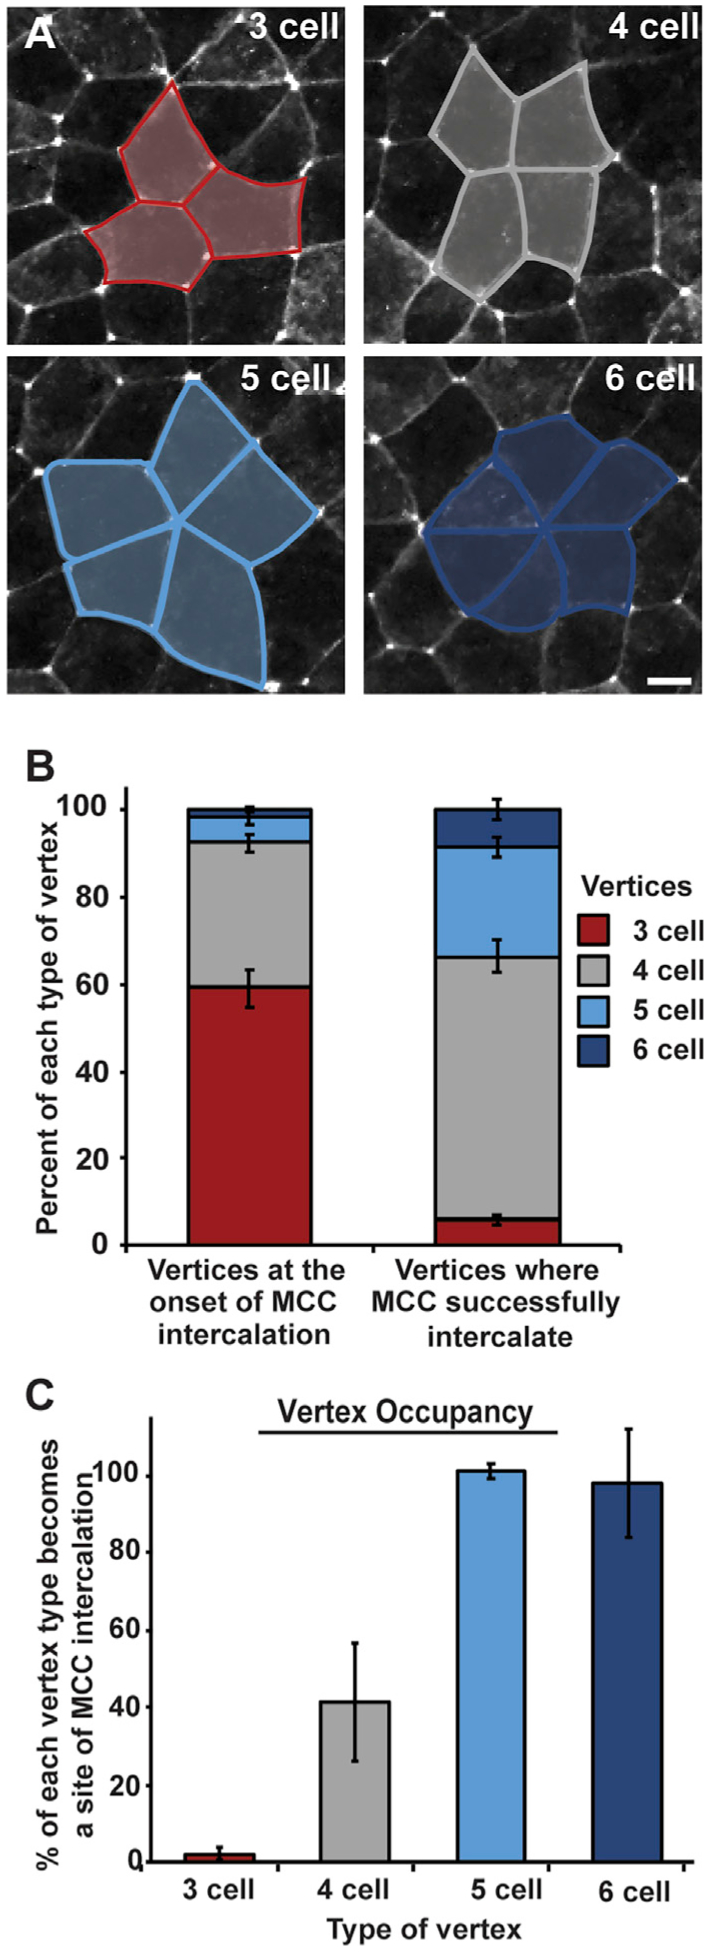
Figure 3. MCCs preferentially intercalate at higher-order vertices.

(A) Representative images of 3-, 4-, 5-, and 6-cell vertices between outer epithelial cells expressing GFP-tricellulin (pseduocolored in white); scale bar represents 10 μm. Vertex types are outlined in blue or gray and are representative of graph colors in (B) and (C).
(B and C) Analysis of live imaging (e.g., Video S1) quantifying the percentage of each vertex type present in the outer epithelium prior to MCC intercalation (B, left) and sites of successful MCC intercalation (B, right). (C) Percentage of each type of vertex occupied with an MCC by stage 20. Bars represent the mean; error bars indicate SD. Analysis includes n > 1,500 vertices (B, left) and n > 350 MCCs (B, right) from 2 embryos; n > 900 vertices (3 cell), 500 vertices (4 cell), 85 vertices (5 cell), and 30 vertices (6 cell) from 2 embryos (C).
