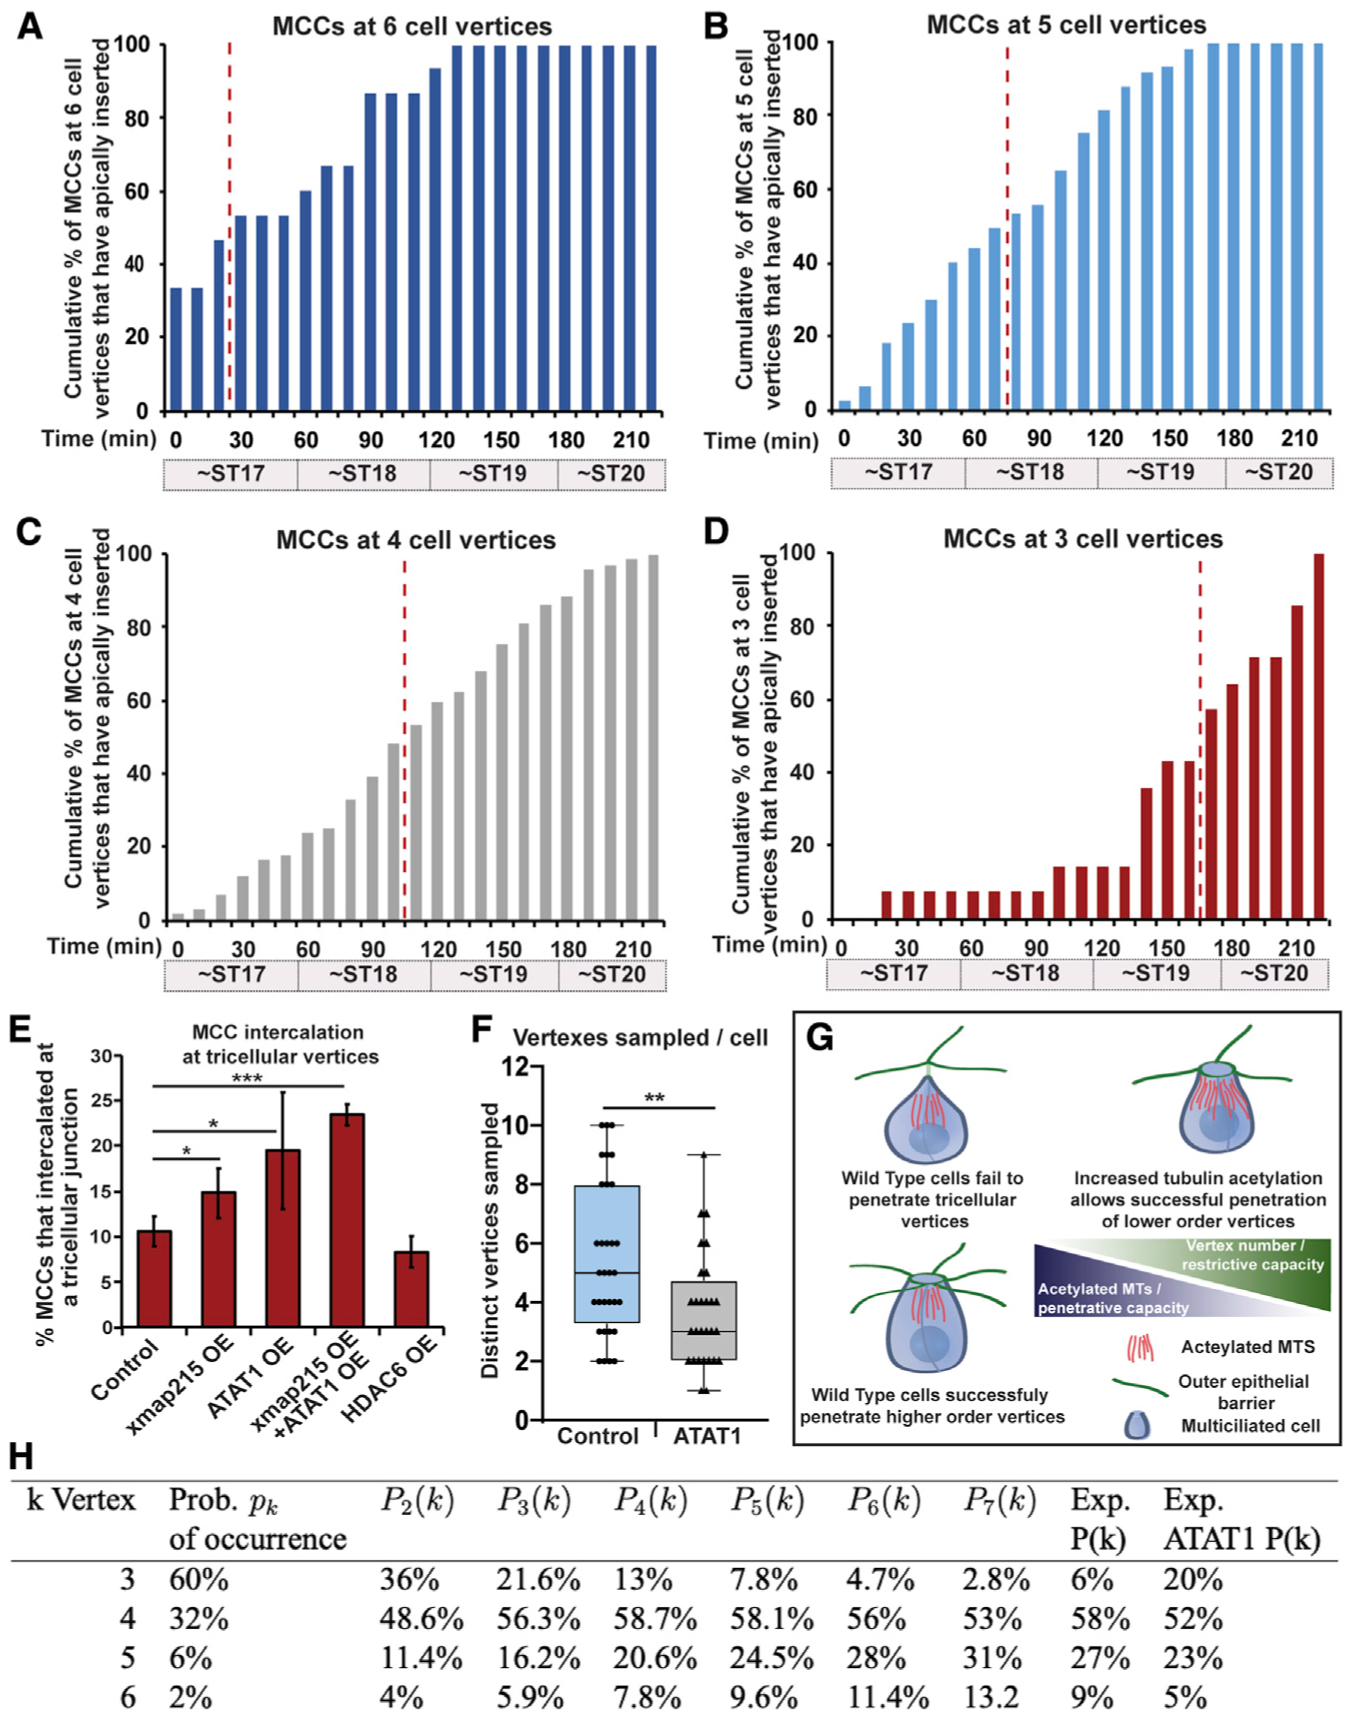
Figure 4. Microtubule acetylation alters the penetrative capacity of MCCs.

(A–D) Quantification of cumulative percentages of MCCs inserting in the outer epithelium at 6-cell (A), 5-cell (B), 4-cell (C), and 3-cell vertices (D) over time. (A–D) Representative data generated from one time-lapse experiment analyzing intercalation of 214 MCCs. Similar trends were seen in other time-lapse videos. Percentages were calculated by dividing the cumulative number of total MCCs that had breached the outer epithelial layer at each time point by the number of MCCs that inserted at that vertex type. Red dotted line on each bar graph indicates the point at which 50% of the cells that would eventually intercalate at the vertex type had successfully breached the epithelium.
(E) Quantification of the percentage of MCCs that intercalated at tricellular vertices by stage 20. For bar graph in (E), bars represent the mean, error bars indicate SD, and *p < 0.05 and ***p < 0.001. Analysis includes n > 350 cells for each condition from at least 9 embryos (E).
(F) Measured value for q, quantification of the number of vertices sampled prior to apical insertion in control and ATAT1 OE MCCs. Data are from 2 4-h movies of each condition with an n of 32 cells for control and 28 cells for ATAT1 OE; for box-and-whisker plot, the box represents the 25%−75% range, the line represents the median, and the whiskers represent the total range; and **p < 0.01.
(G) Model of the balance of the restrictive capacity of the epithelium that varies by vertex strength and the penetrative capacity of intercalating cells that varies by the amount of tubulin acetylation.
(H) Probability that an MCC successfully intercalates at a k-vertex, using Equation 1. Experimental data (Exp. P(k) column) is from Figure 3B (right). Distribution of vertex type (Prob. of occurrence column) is from Figure 3B (left). Exp. ATAT1 P(k) represents the observed percentage for each vertex type in MCC OE ATAT1. This table shows the dependence on q of the probability that an MCC successfully intercalates at a k-vertex, using Equation 1.
