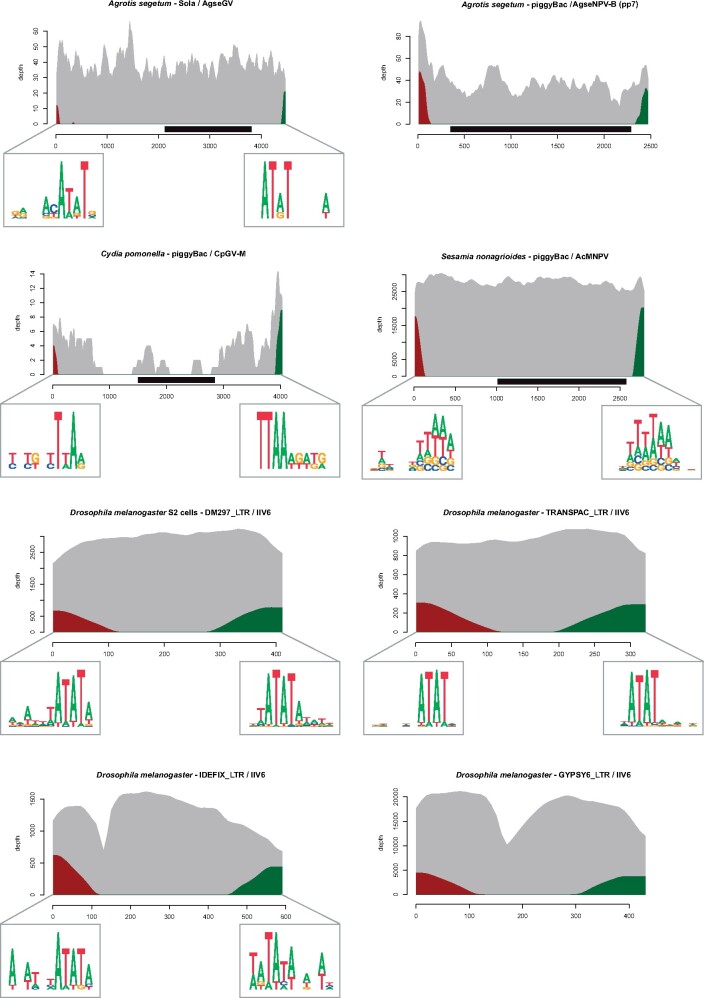
Fig. 3.
Sequencing depth of some of the TEs found integrated into viral genomes. Sequencing depth by reads mapping entirely on the TEs is shown in gray. Sequencing depth by chimeric reads is shown in red on the 5′-end of the TEs and in green for the 3′-end of the TEs. Black rectangles represent TE genes annotated in autonomous TE sequences. TSDs are shown on each side of the elements using sequence logos for all TEs for which conserved TSDs were observed (sequencing depth of the other TEs uncovered in this study is shown in supplementary fig. S2, Supplementary Material online).

