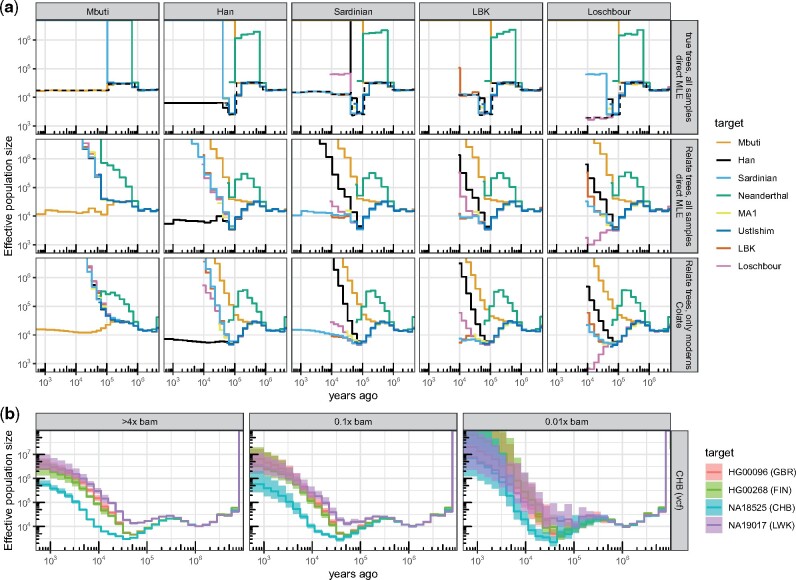
Fig. 2.
(a) Simulation emulating real human groups, including three modern human groups (Mbuti, Han, and Sardinian) with 100 diploid sequences each, and five diploid ancient genomes. We calculated coalescence rates between groups using true genealogical trees of all samples (true trees; direct MLE), inferred Relate trees of all samples (Relate trees; direct MLE), and Colate, where the genealogy used to date mutations included all modern human groups but not the ancient samples. For the direct MLEs, coalescence rates are symmetric with respect to target and reference group assignment; for Colate, each panel corresponds to a fixed reference group, with different colored lines showing different target groups. Five reference groups are shown here, see supplementary figure 3, Supplementary Material online, for remaining groups. Dashed lines show true within-group population sizes. (b) Colate-inferred coalescence rates between four 1000 Genomes Project samples (HG0096, HG00268, NA18525, NA19017) and the remaining 1000 Genomes samples of Han Chinese in Beijing (CHB) (see supplementary fig. 3, Supplementary Material online, for rates to YRI and CEU). The target samples are given as reference-aligned read data downsampled to 4x, 0.1x, and 0.01x mean coverage. Confidence intervals are constructed using 100 block bootstrap iterations with a block size of 20 Mb.

