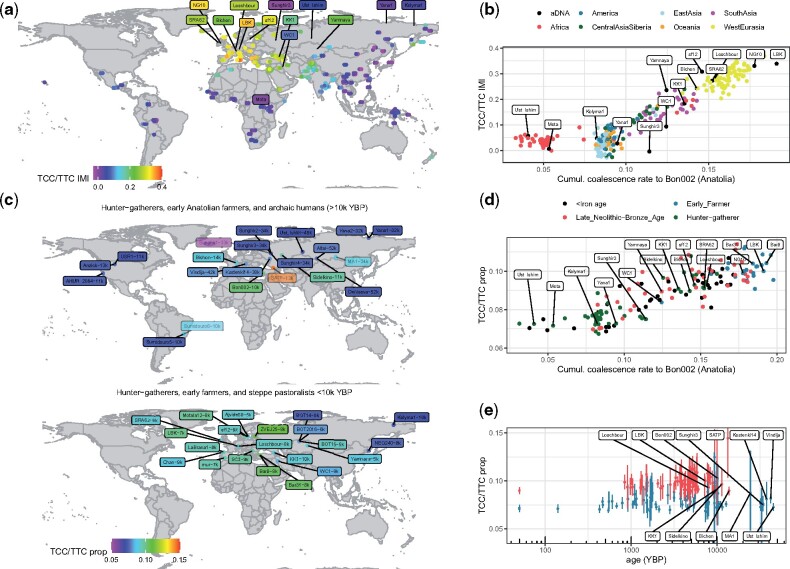
Fig. 6.
(a) Map showing the strength of the TCC/TTC mutation rate signature, quantified by calculating the “IMI” of the TCC/TTC mutation rate (see Materials and Methods). Circles correspond to present-day individuals in the SGDP data, ancient individuals are labeled. (b) TCC/TTC IMI plotted against the Colate-inferred coalescence rates to Bon002, a 10k-year-old individual from Anatolia, integrated between 14k and 50k YBP. Circles correspond to SGDP samples, labels to ancients. (c) Map showing the TCC/TTC mutation rate signature in lower coverage ancients, quantified as the proportion of sites that are TCC/TTC relative to other C/T transitions excluding those in CpG contexts (see Materials and Methods). Top shows a subset of samples >10k years old, bottom shows samples <10k years old (see supplementary fig. 13, Supplementary Material online, for further samples). Samples of <2x mean coverage are shown with increased transparency. Number following sample ID shows sample age. (d) Proportion of TCC/TTC sites plotted against coalescence rates to Bon002, integrated between 14k and 50k YBP. All points correspond to ancients, color indicates their age. (e) Proportion of TCC/TTC sites plotted against sample age. Confidence intervals are obtained using a block bootstrap. Samples are colored using a k-means clustering (k = 2). In (c, d, e), samples are >2x mean coverage, except for those >10k years old where we included samples >1x mean coverage.

