Figure 1.

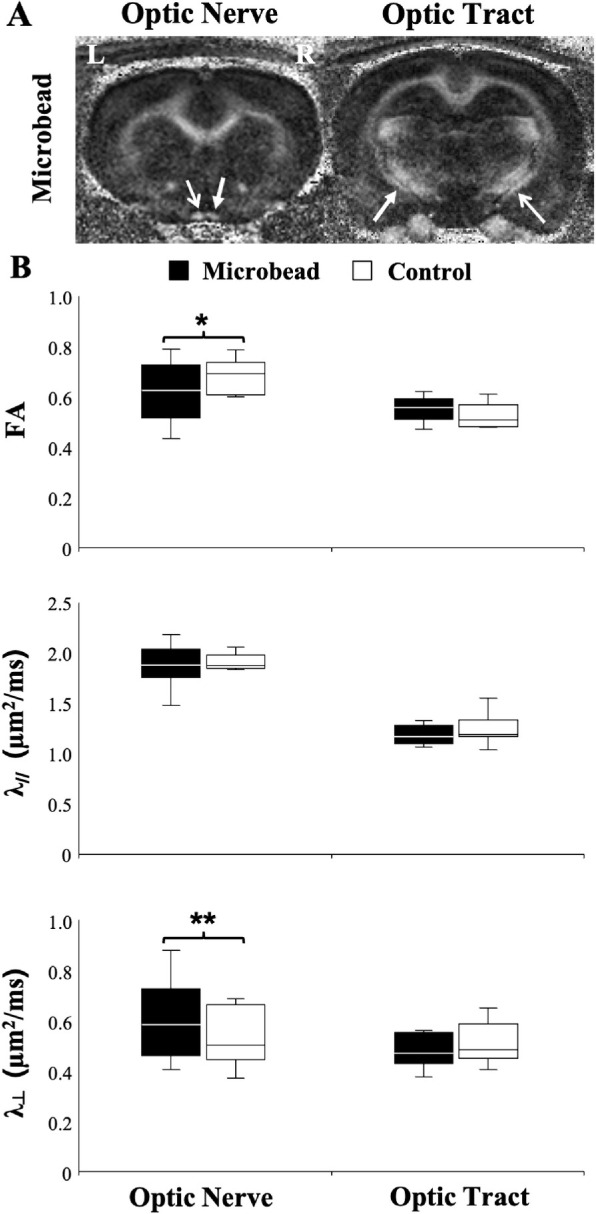
DTI of the rat optic nerve and optic tract under microbead-induced experimental glaucoma versus control. (A) FA maps showing the injured right optic nerve and left optic tract (closed arrows) after experimental glaucoma induction in the right eye via intracameral microbead injection, and the left optic nerve and right optic tract corresponding with the untreated control left eye (open arrows). (B) Comparisons of FA, axial diffusivity (λ//), and radial diffusivity (λ⊥) between the optic nerves and tracts projected from the glaucomatous right eyes (black) and the control left eyes (white). A t test between glaucomatous and control visual pathways: *P < 0.05; **P < 0.01. Data are displayed as box and whisker plots, with caps representing minimum and maximum values, and boxes representing interquartile range with median line shown.
