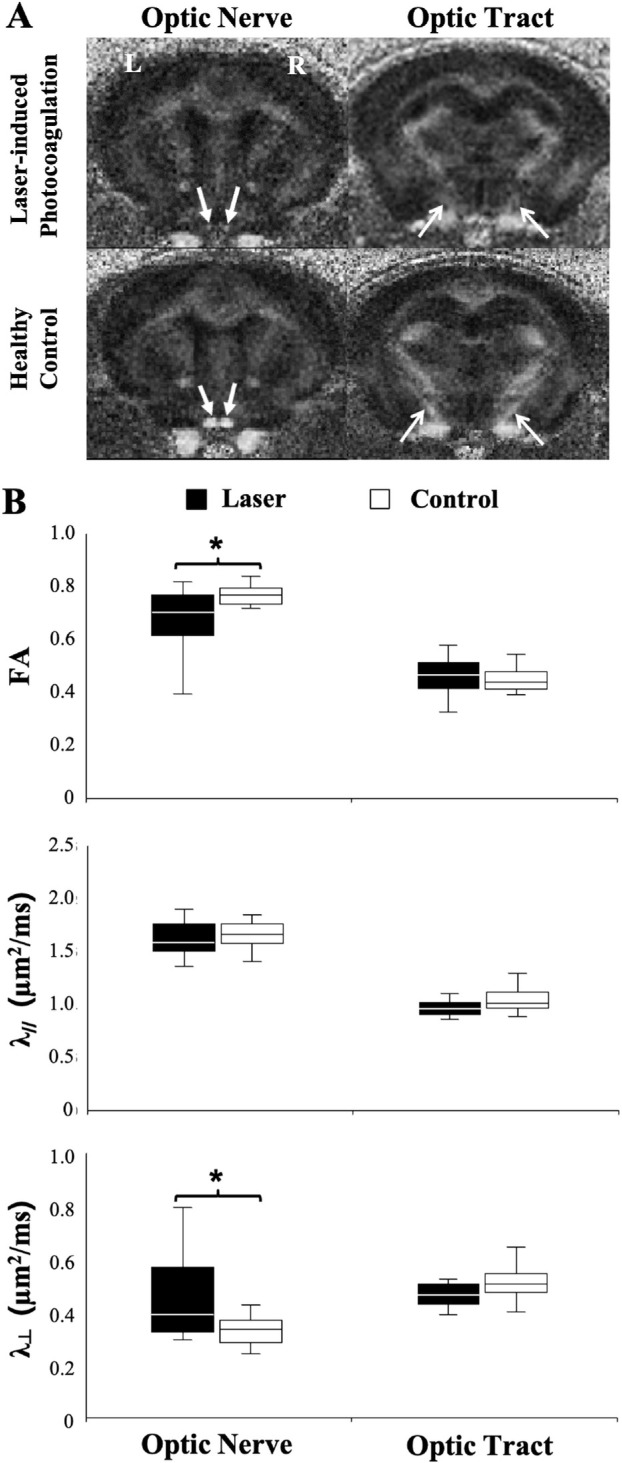
Figure 2.

DTI of the mouse optic nerve and optic tract under laser-induced experimental glaucoma versus age-matched controls. (A) FA maps showing the optic nerves (closed arrows) and optic tracts (open arrows) after experimental glaucoma induction via bilateral laser photocoagulation of the mouse trabecular meshwork (top row), and in the healthy control mice (bottom row). (B) Comparisons of FA, axial diffusivity (λ//), and radial diffusivity (λ⊥), between glaucomatous (black) and control visual pathways (white). A t test between glaucoma and control mice: *P < 0.05. Data are displayed as box and whisker plots, with caps representing minimum and maximum values, and boxes representing interquartile range with median line shown.
