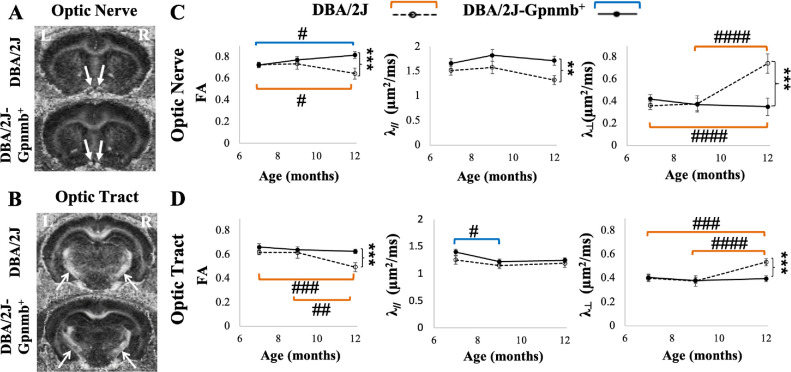
Figure 3.
Longitudinal analysis of DTI parameters in the DBA/2J mouse model of pigmentary glaucoma and the DBA/2J-Gpnmb+ control strain. (A, B) FA maps showing the optic nerves (A, closed arrows) and optic tracts (B, open arrows) of the DBA/2J (top) and DBA/2J-Gpnmb+ control groups (bottom) at 12 months old. (C, D) Comparisons of FA, axial diffusivity (λ//), and radial diffusivity (λ⊥) in the optic nerves (C) and optic tracts (D) between DBA/2J and DBA/2J-Gpnmb+ groups at 7, 9, and 12 months old. Post hoc Sidak tests between DBA/2J and DBA/2J-Gpnmb+ mice: *P < 0.05, **P < 0.01, ***P < 0.001; between ages within the same strains: #P < 0.05, ##P < 0.01, ###P < 0.001, ####P < 0.0001, with orange and blue brackets indicating longitudinal comparisons within DBA/2J and DBA/2J-Gpnmb+ groups, respectively. Data are represented as mean ± standard error of the mean.

