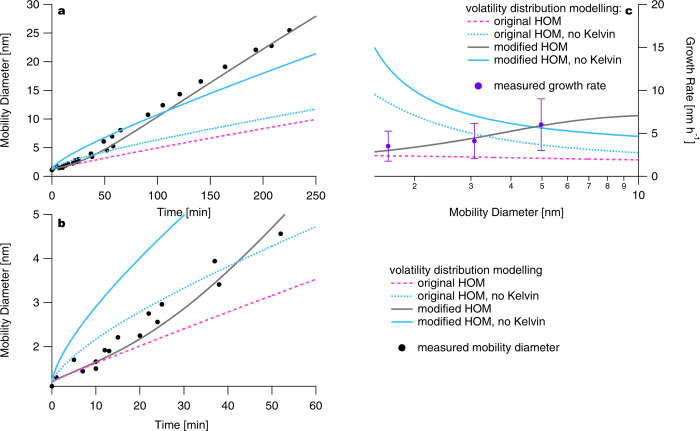
Extended Data Figure 6. Dynamic volatility-distribution modelling results with and without a Kelvin term and with original and modified HOM volatility distribution for the case of constant HOMs.
a, Different model approaches (key at bottom right) compared to the measured diameter evolution. b, Enlargement of the first 30 min of the experiment and the first 5 nm of the diameter evolution (key in panel). c, Size dependent growth rate for different model approaches (key at bottom right). The Kelvin effect is essential to describe the measured diameter behaviour. Using the original volatility distribution (blue dashed line), the model slightly overestimates the initial growth but strongly underestimates it at larger sizes. Although considering a Kelvin effect fits the initial growth well, growth at larger sizes is underestimated even more (pink dashed line). By adjusting the HOM volatility distribution in the model with no Kelvin effect, the best fit (blue solid curve) still fails to reproduce the observations, substantially overpredicting growth at small sizes and then underpredicting growth at larger sizes. However, adjusting the volatility distribution and treating the Kelvin effect captures the growth well over the full size range (grey solid line). Error bars indicate the 1σ systematic scale uncertainty of the determined growth rates.

