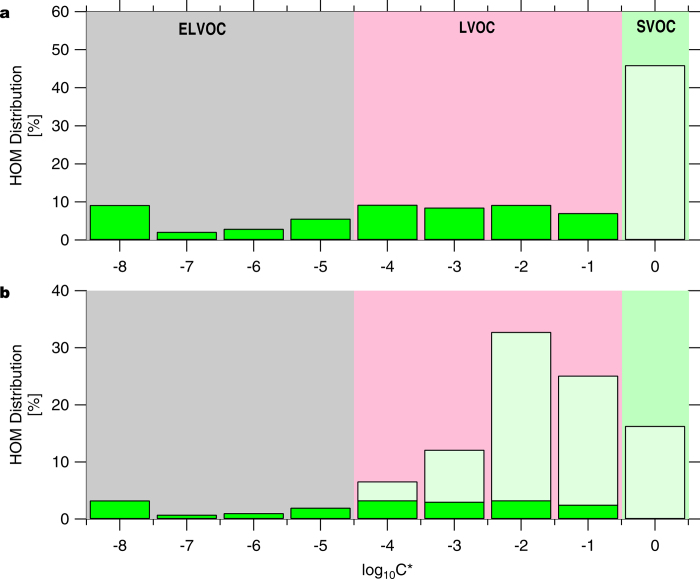
Extended Data Figure 5. HOM distribution binned to a VBS.
a, Measured HOM distribution (dark green) binned to a VBS. As the nitrate-CI-APi-TOF is expected to underestimate SVOC, which are often observed during secondary aerosol formation in smog chamber studies, we added a representative SOA bin at logC* = 0 (light green). b, Modified HOM distribution after scaling for the weaker charging efficiency for LVOC (light green). The ELVOC:LVOC:SVOC ratios are a, 20:34:46 and b, 7:77:16.

