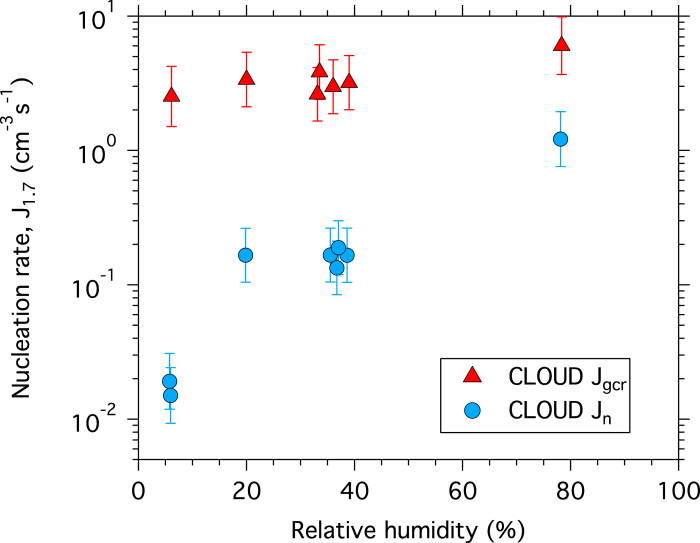
Extended Data Figure 6. Nucleation rates versus relative humidity.
Neutral (Jn; circles) and GCR (Jgcr; triangles) nucleation rates versus relative humidity. The experimental conditions are 250–800 p.p.t.v. α-pinene, 30–35 p.p.b.v. O3, zero H2 or HONO, (1.1−2.9) × 107 cm−3 HOM, 278 K and (0.5−1.5) × 105 cm−3 H2SO4. All measurements have been corrected to the same total HOMs concentration (2.05 × 107 cm−3) using the curves shown in Fig. 3. The bars indicate 1σ total errors, although these are not shown in the x direction because they are smaller than the symbols.

