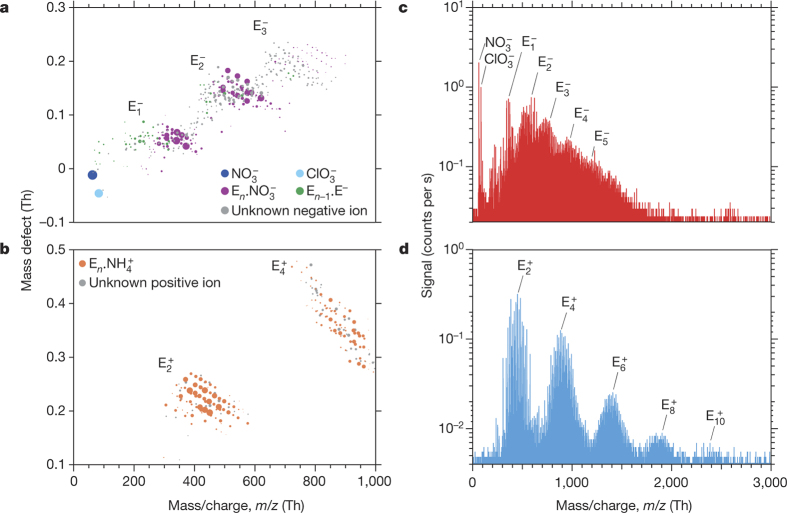
Figure 2. Molecular composition and mass spectra of charged clusters during GCR nucleation events without sulfuric acid.
a, b, Cluster mass defect (difference from integer mass) versus m/z of negatively (a) and positively (b) charged clusters measured with the APi-TOF at 240 p.p.t.v. α-pinene, 34 p.p.b.v. O3, zero H2 or HONO, 38% relative humidity, 278 K and [H2SO4] below the detection limit (5 × 104 cm−3). The values of Jgcr and total HOMs concentration are, respectively, 3.4 cm−3 s−1 and 1.7 × 107 cm−3 (a), and 3.3 cm−3 s−1 and 2.4 × 107 cm−3 (b). The mass bands are labelled according to the number of HOM monomer units in the cluster, En. Each circle represents a distinct molecular composition and its area represents the counts per second. The most highly oxidized compounds are located at the lower right-hand edge of each band. The dark blue circle represents  ions; the light blue circle represents
  ions. Clusters with fully identified molecular composition are coloured according to their core ion: purple (
 ), green (E−) or orange (
 ). Grey circles are unidentified clusters. c, d, Mass spectra from the same events for negative (c) and positive (d) clusters up to m/z = 3,000 Th. A particle of 1.7-nm mobility diameter has a mass of about 1,200 Th. The ‘Nessie’ plot (d) shows that positive-ion-induced nucleation involves HOM dimers alone (E1.
 clusters are not seen owing to instrument tuning). The decreasing signal amplitude at larger masses is due to the lower concentration and decreasing detection efficiency of the APi-TOF mass spectrometer (the efficiency versus m/z depends on the instrument tune and polarity).

