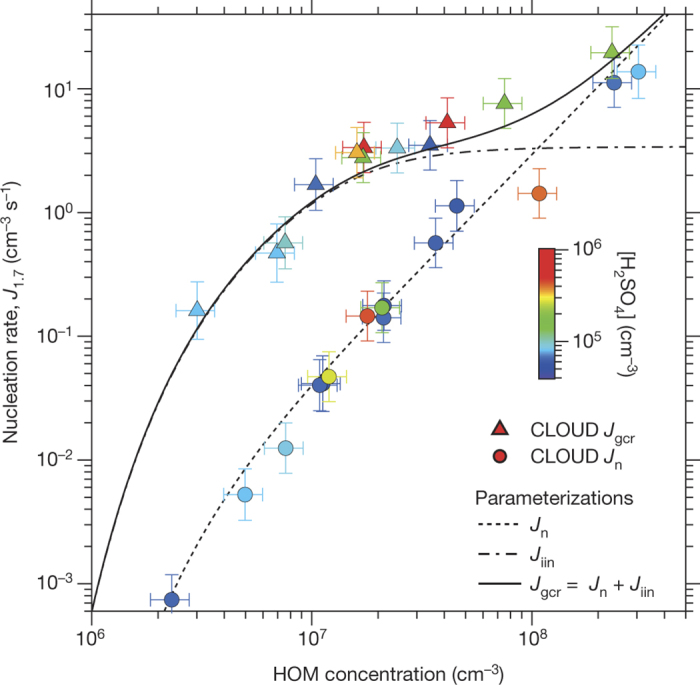
Figure 3. Pure biogenic nucleation rates versus HOM concentration.

Neutral (Jn; circles) and GCR (Jgcr; triangles) nucleation rates versus total HOMs concentration (RO2· + E1 + E2). The fraction of total HOMs that participate in nucleation (ELVOCs) is about 36% (ref. 21). The experimental conditions are 10–1,300 p.p.t.v. α-pinene (for measurements below J1.7 = 10 cm−3 s−1), 30–35 p.p.b.v. O3, zero H2 or HONO, 38% relative humidity, 278 K and <8 × 105 cm−3 H2SO4. The colour scale shows [H2SO4]; purple and blue points correspond to contaminant level (below the detection threshold); other colours correspond to measurements after SO2 was added to the chamber. The fitted curves show parameterizations (described in Methods) for Jn (dashed), Jgcr (solid) and ion-induced nucleation (Jiin = Jgcr − Jn; dot-dashed). The Jiin parameterization assumes that the nucleation rate falls steeply at HOM concentrations below the experimental measurements, following a similar slope to that for Jn. The bars indicate 1σ total errors, although the overall systematic scale uncertainty of +80%/−45% on the HOM concentration is not shown.
