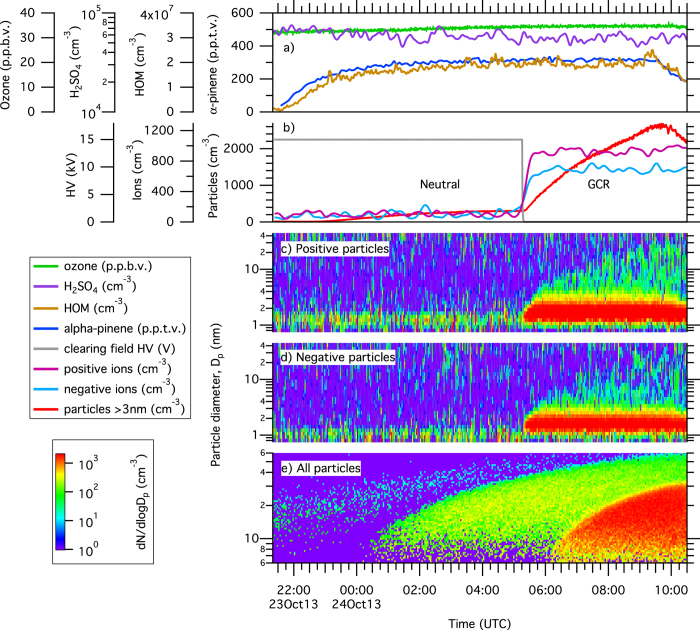
Extended Data Figure 4. Typical nucleation run sequence.
Example of a typical measurement sequence of the neutral and GCR nucleation rates as a function of coordinated universal time (utc), at zero H2 or HONO, 38% relative humidity and 278 K. a, The run began at 21:22, 23 October 2013, by starting the α-pinene flow into the chamber to reach a chosen equilibrium value near 300 p.p.t.v., which produced an equilibrium total HOMs concentration near 2 × 107 cm−3 (0.8 p.p.t.v.). b, Particles (red curve) formed at a slow rate in the chamber without ions present (‘neutral’ conditions). The clearing field high voltage (HV) was turned off at 05:16, 24 October 2013, and the subsequent presence of ions in the chamber from GCRs caused a sharp increase in the particle formation rate by about one order of magnitude (as seen by the increase in the gradient of the red curve). The nucleation rates are measured under constant gas conditions in the period before (Jn = 0.14 cm−3 s−1) and after (Jgcr = 3.3 cm−3 s−1) turning off the clearing field high voltage. c, d, Ion-induced nucleation is observed both for positive (c) and negative (d) charged particles, followed by rapid particle growth to sizes above 10 nm. e, The nucleated particles grew over a period of several hours to diameters approaching 50 nm, where they begin to constitute cloud condensation nuclei. A sharp increase in the formation rate of particles above the SMPS detection threshold of 5 nm can be seen when GCR ions are present. The colour scale in c–e indicates dN/dlog(Dp), where N (in cm−3) is the particle number concentration and Dp (in nm) is the particle diameter. The concentrations of ozone and contaminant H2SO4 were essentially constant during the run, which ended at 09:30 when the α-pinene flow to the chamber was turned off. The H2SO4 measurement near 5 × 104 cm−3 corresponds to the instrumental background level of the CI-APi-TOF mass spectrometer and so represents an upper limit on the actual concentration. Further characteristics of this run can be seen in Fig. 1.

