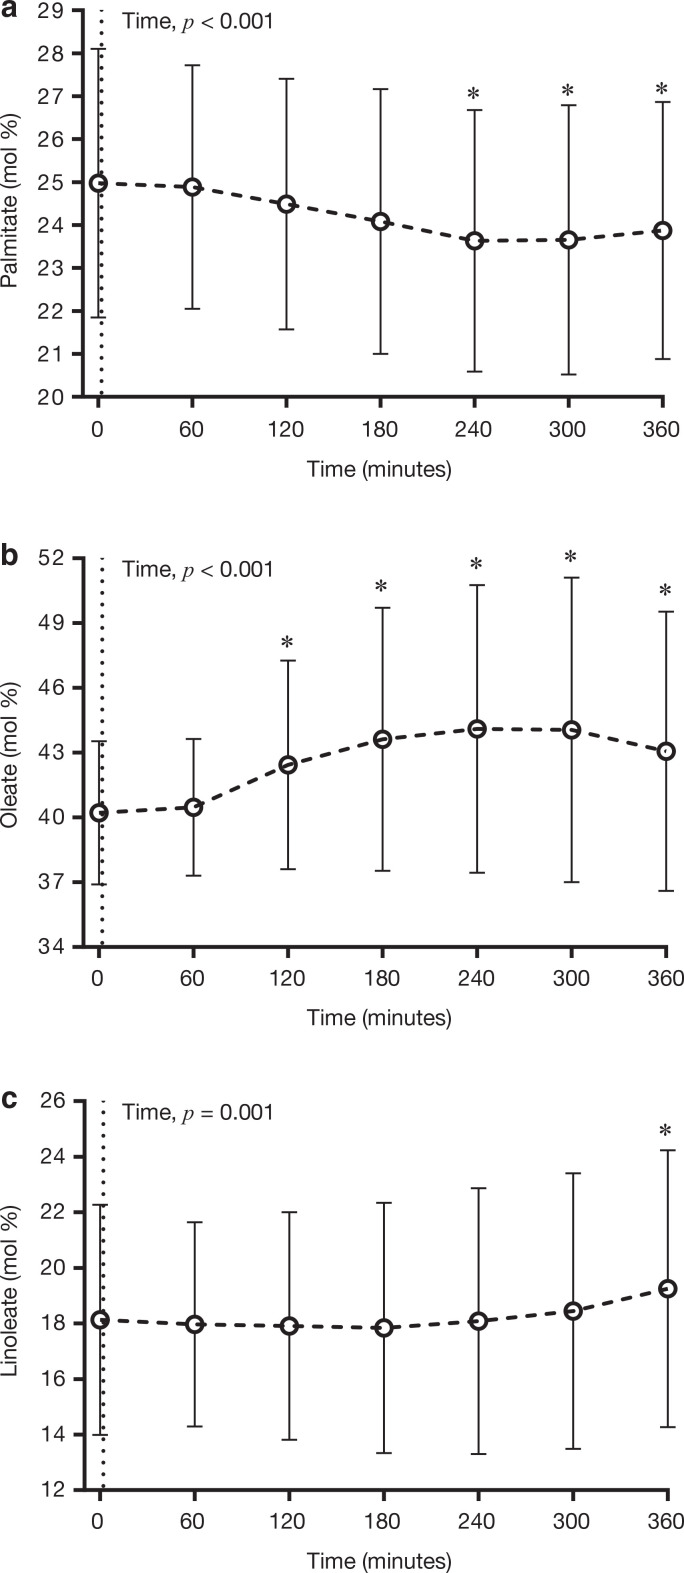
Figure 2.
Temporal changes in the relative abundance of (a) palmitate, (b) oleate and (c) linoleate in plasma TG in response to the consumption of a high-fat test meal. Data are presented as mean ± SD. n = 98. *P < 0.05 compared to fasting (Time 0). The dotted line at Time 0 denotes the consumption of the experimental test meal.

