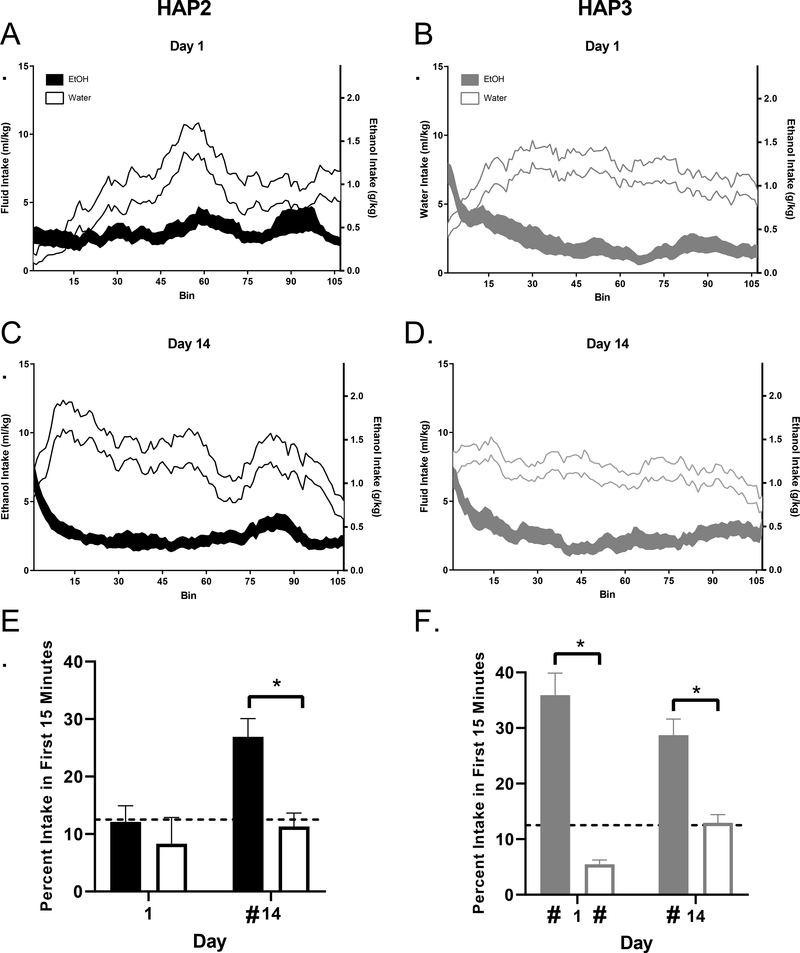
Figure 2. Assessment of Front-Loading.
Intake patterns (displayed as means of central moving averages ± SEM) for each replicate were compared on day 1 (A and B) versus day 14 (C and D). Except for day 1 in HAP2 mice, the EtOH groups always had a significantly higher proportion of intake within the first 15 minutes (front-loading) than the water group (E and F). * indicates significant group differences as indicated by Sidak’s post-hoc testing which were conducted following a main effect of group in both replicates, see Results. # Indicates percentage of intake significantly differed from the 12.5% frontloading threshold, indicating front-loading in EtOH groups with the exception of HAP2 day 1.

