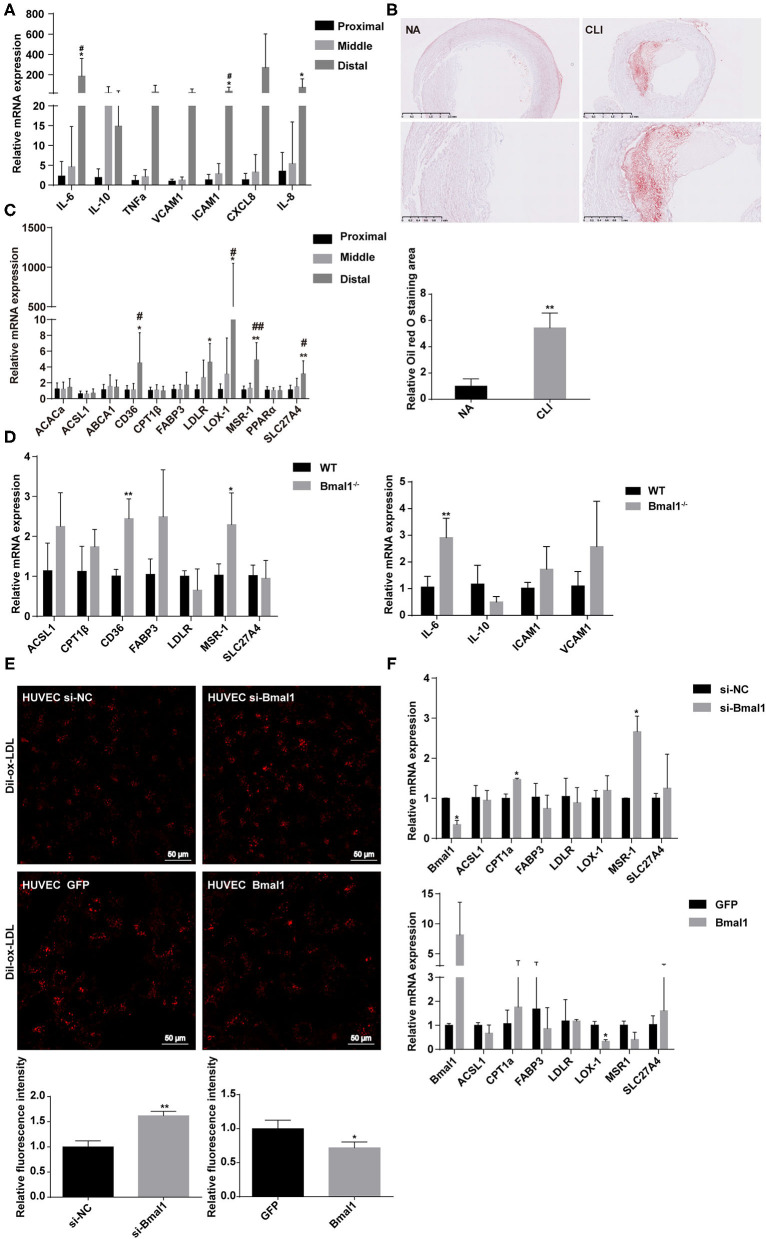
Figure 2.
Bmal1 inhibits lipid uptake by endothelial cells. (A) Relative mRNA expression of inflammation factors by real-time PCR. Data are presented as mean ± SEM (n = 9, one-way ANOVA with post-hoc Tukey test). *p < 0.05 distal lower limb vs. proximal lower limb; #p < 0.05 distal lower limb vs. middle lower limb. (B) Oil red O staining of normal artery and femoral artery from critical limb ischemia (CLI) patients. Oil red O staining area are measured with Image J. Data are presented as mean ± SEM (n = 3, unpaired t-test); **p < 0.01 CLI vs. NA. (C) Relative mRNA expression of genes involved in lipid metabolism in the lower limb muscle of CLI patients. Data are presented as mean ± SEM (n = 9, one way ANOVA with post-hoc Tukey test). *p < 0.05 and **p < 0.01, distal lower limb vs. proximal lower limb; #p < 0.05 and ##p < 0.01, distal lower limb vs. middle lower limb. (D) Relative mRNA expression of genes involved in lipid metabolism and inflammation in wild-type and Bmal1−/− mice lower limb muscle. Data are presented as mean ± SEM (n = 4, unpaired t-test). *p < 0.05 and **p < 0.01, Bmal1−/− vs. WT. (E) Dil-ox-LDL uptake by human umbilical vein endothelial cells (HUVECs), with the expression changes of Bmal1 measured by confocal microscopy. Ox-LDL uptake is measured with the relative fluorescence intensity. Data are presented as mean ± SEM (unpaired t-test, repeated 3 independent times). **p < 0.01 si-Bmal1 vs. si-NC and *p < 0.05 Bmal1 vs. GFP. (F) Relative mRNA expression of genes involved in lipid metabolism in HUVECs with the expression changes of Bmal1. Data are presented as mean ± SEM (unpaired t-test, repeated 3 independent times). *p < 0.05, si-Bmal1 vs. si-NC; *p < 0.05 Bmal1 vs. GFP.

