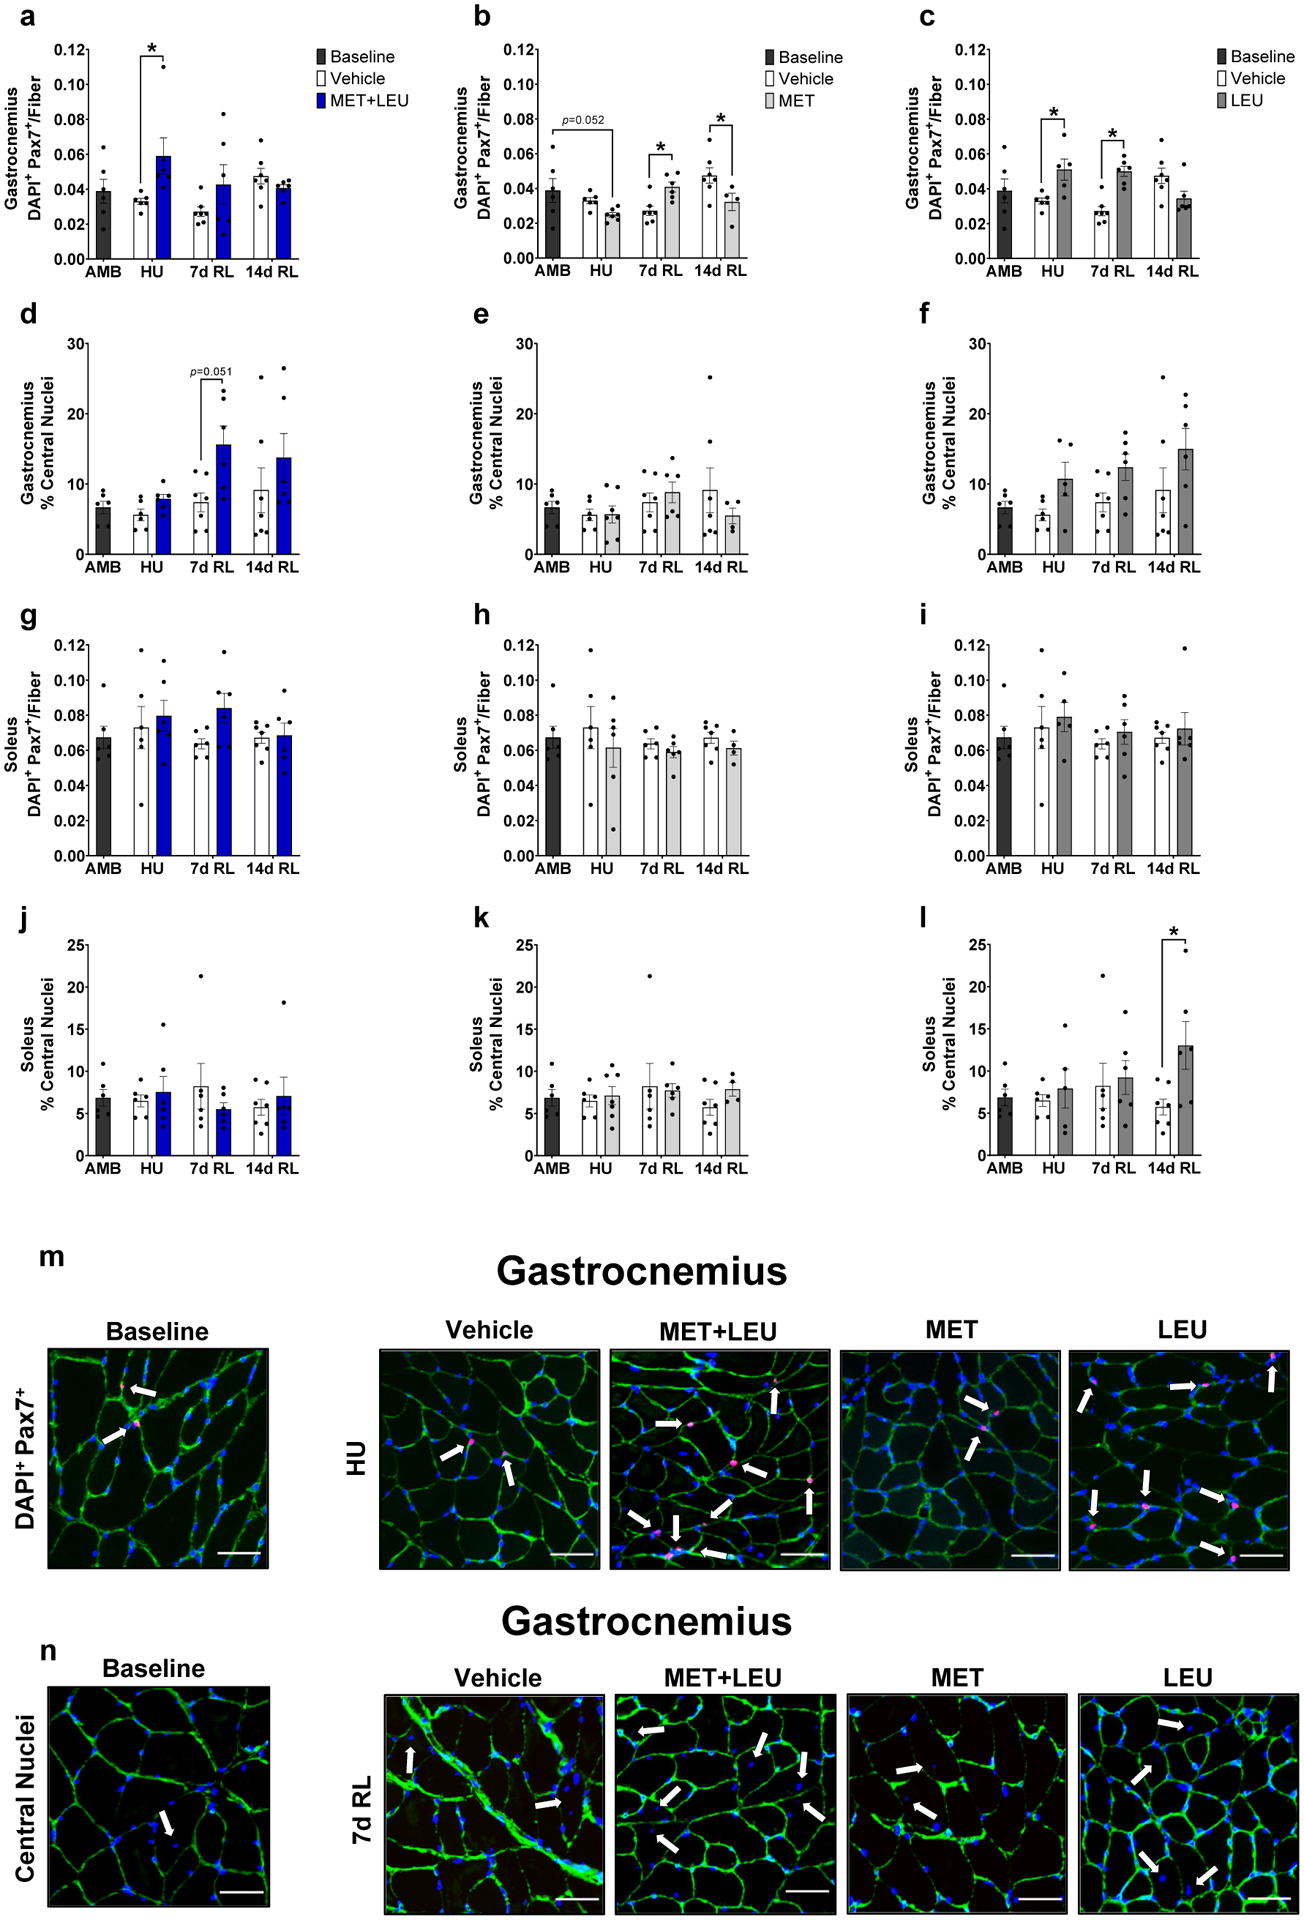
Fig. 3.

Gastrocnemius and soleus satellite cells and central nuclei. (a-c) Gastrocnemius satellite cells determined by DAPI+ and Pax7+ cells within the extracellular niche in AMB, Vehicle, MET+LEU, MET and LEU. (d-f) Gastrocnemius percentage of central nuclei in AMB, Vehicle, MET+LEU, MET and LEU. (g-i) Soleus satellite cells determined by DAPI+ and Pax7+ cells within the extracellular niche in AMB, Vehicle, MET+LEU, MET and LEU. (j-l) Soleus percentage of central nuclei in AMB, Vehicle, MET+LEU, MET and LEU. (m) Representative images of gastrocnemius satellite cells during HU with AMB, Vehicle, MET+LEU, MET and LEU. White arrows denote DAPI+ and Pax7+ cells within the extracellular niche. (n) Representative images of gastrocnemius central nuclei at 7d RL in AMB, Vehicle, MET+LEU, MET and LEU. White arrows denote central nuclei. Scale bar for representative images is 50 μm. # p<0.05 vs. AMB, * p<0.05 vs. Vehicle. N=4–7/group.
