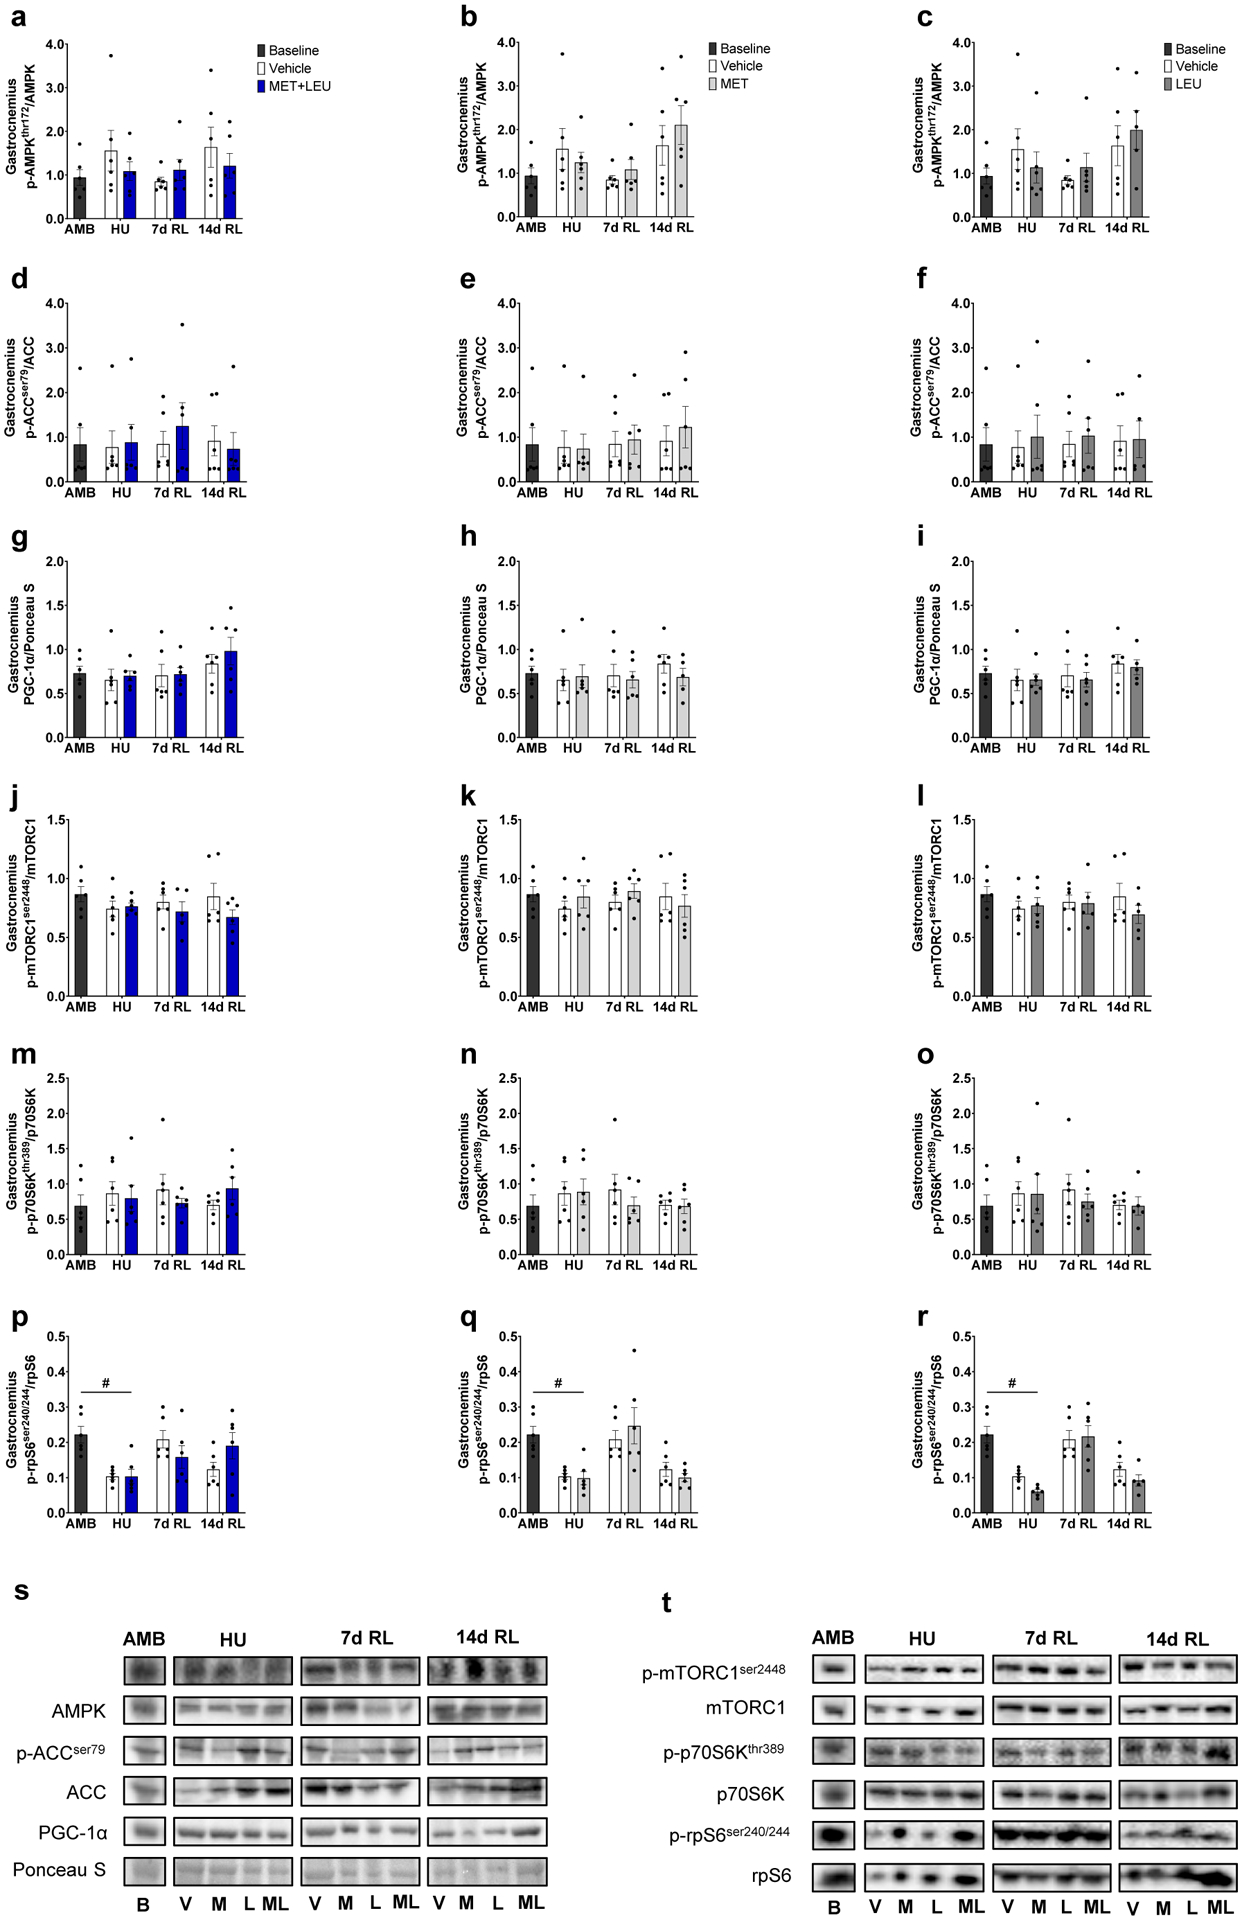
Fig. 5.

Gastrocnemius AMPKα and mTORC1 signaling. (a-c) Phosphorylated AMPKα threonine 172: total AMPK ratio in AMB, Vehicle, MET+LEU, MET and LEU. (d-f) Phosphorylated ACC serine 79: total ACC ratio in AMB, Vehicle, MET+LEU, MET and LEU. (g-i) Total PGC-1α: total protein determined by Ponceau S staining in AMB, Vehicle, MET+LEU, MET and LEU. (j-l) Phosphorylated mTOR serine 2448: total mTOR ratio in AMB, Vehicle, MET+LEU, MET and LEU. (m-o) Phosphorylated p70S6K threonine 389: total p70S6K ratio in AMB, Vehicle, MET+LEU, MET and LEU. (p-r) Phosphorylated rpS6 serine 240/244: total rpS6 ratio in AMB, Vehicle, MET+LEU, MET and LEU. (s) Representative immunoblots of AMPKα signaling. (t) Representative immunoblots of mTORC1 signaling. # p<0.05 vs. AMB. N=6/group.
