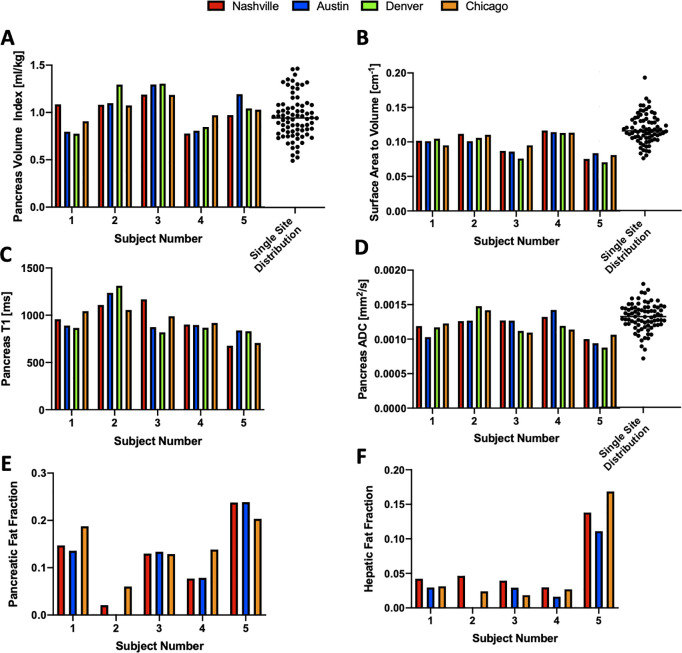
Fig 3. Quantitative MRI measures for 5 individuals scanned on four different MRI centers.
Values for each MRI measurement of the pancreas are displayed for: A) pancreas volume index (PVI), B) surface area to volume ratio, C) longitudinal relaxation time (T1), D) apparent diffusion coefficient (ADC), E) pancreatic fat fraction, and F) hepatic fat fraction. Note that fat fraction was not measured in Denver due to a lack of the requisite software. For the graphs of PVI, surface area to volume ratio, and ADC, the distribution of values calculated in healthy volunteers at a single site study (updated from a previously published study [5]) is indicated by dot plot in panels A, B, D.

