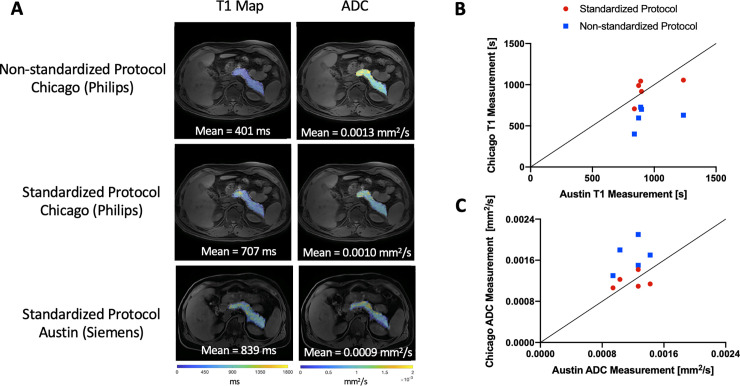
Fig 4. Representative difference in quantitative MRI measurements induced by use of different image processing between sites.
A) Representative maps of T1 relaxation time (left column) and ADC (right column) displayed in pseudo color over a T1-weighted image. The top row displays images acquired in Chicago and processed using a non-standardized image processing protocol, demonstrating differences in T1 and ADC values from the standardized protocol (middle row). Images acquired and processed using the standardized MAP-T1D protocol in Chicago on a Philips MRI scanner (middle row) and Austin on a Siemens MRI scanner (bottom row) display concordance for T1 and ADC. All sets of parametric maps are scaled identically for visualization. B) Mean pancreatic T1 values are more reproducible between two sites (Chicago and Austin) using the standardized image analysis protocol (red circles), than when using non-standardized image processing (blue squares). The line of identity indicates perfect agreement. C) Mean pancreatic ADC values are more reproducible between two sites (Chicago and Austin) when using the standardized image analysis protocol (red circles), than when using non-standardized image processing (blue squares).

