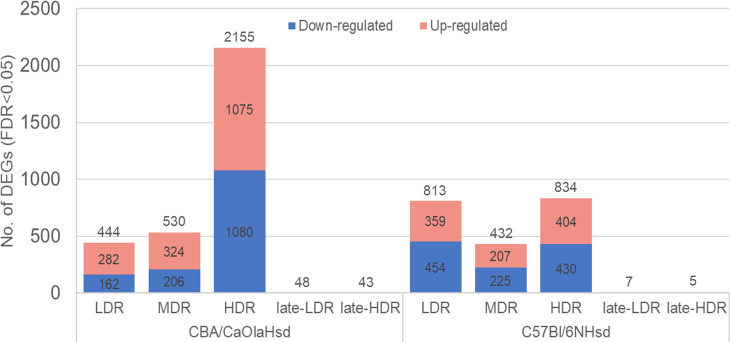
Fig 2. Numbers of differentially expressed genes.
Total numbers of statistically significant (FDR<0.05) differentially expressed genes (DEGs) one day post-radiation (LDR, MDR, and HDR) and following recovery of >100 days post-radiation (late-LDR and late-HDR). The stacked bar plot indicates the numbers of significant DEGs (compared to control) for each dose rate and mouse strain (total number DEGs are seen over the bar; upper section (red): Number of up-regulated DEGs; lower section (blue): Numbers of down-regulated DEGs). For late-LDR and late-HDR, only total numbers of DEGs are given.

