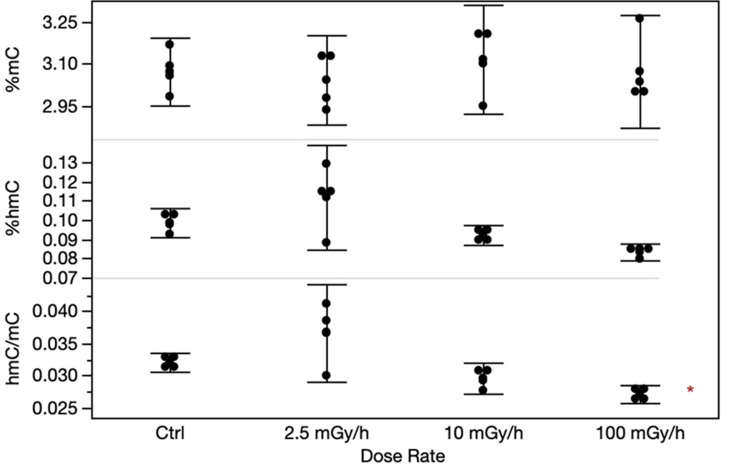
Fig 8. The levels of global methylation in CBA/CaOlaHsd livers analyzed by HPLC-MS/MS.
In the panels, %mC (upper panel) and %hmC (mid panel), and the ratio between %hmC and %mC (lower panel) are shown. Each error bar represents the 95% confidence intervals of the means. Asterisk indicate borderline significance (p = 0.043) for the HDR hmC:mC-ratio.

