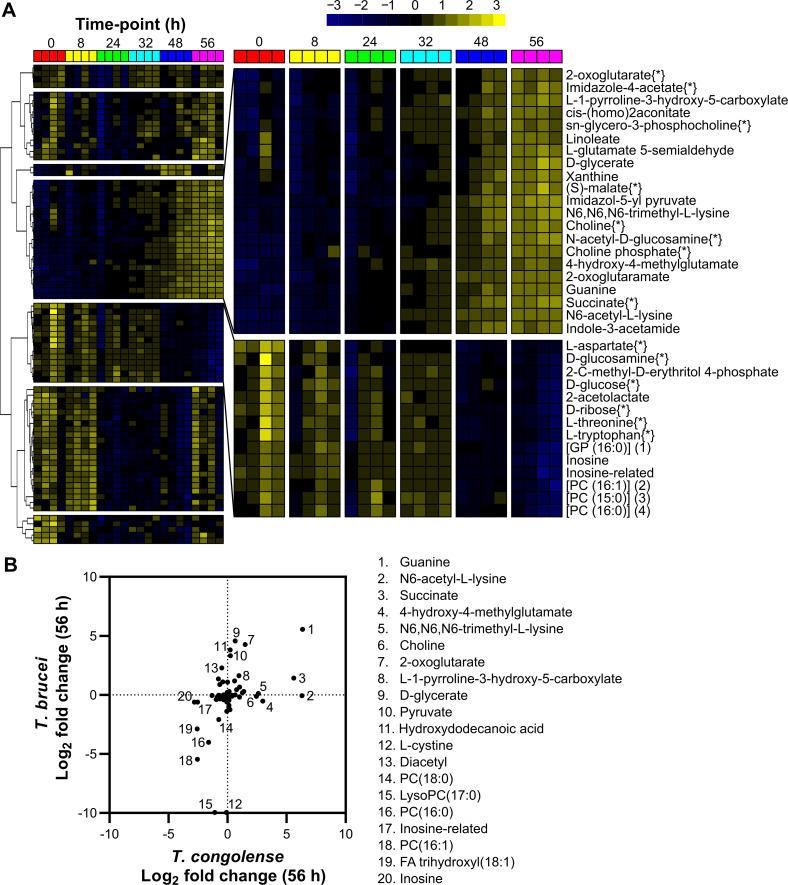
Fig 2. Analysis of supernatant metabolites after T. congolense culture.
A heatmap covering the 80 putative medium components judged to be significantly altered after 56 hours of in vitro cell culture containing T. congolense strain IL3000, as calculated by a one-way repeated measures ANOVA (P < 0.05). Peak abundances were log transformed and mean centred and metabolites were clustered based on Pearson correlation. Two clusters of interest were identified, which are shown in a larger format on the right. Metabolites in the top cluster were observed to increase significantly over time, whilst those in the bottom cluster decreased. Metabolite names followed by {*} were matched to an authentic standard and all other identifications are putative based on mass, retention time and formula. B) Comparison of metabolite changes in medium supernatants after 56 hours between T. brucei [60] and T. congolense (S3 Table). Relative changes in metabolite abundance were calculated as log2 fold change of 56 h vs 0 h and metabolites exhibiting differences between the species are listed next to the figure.

