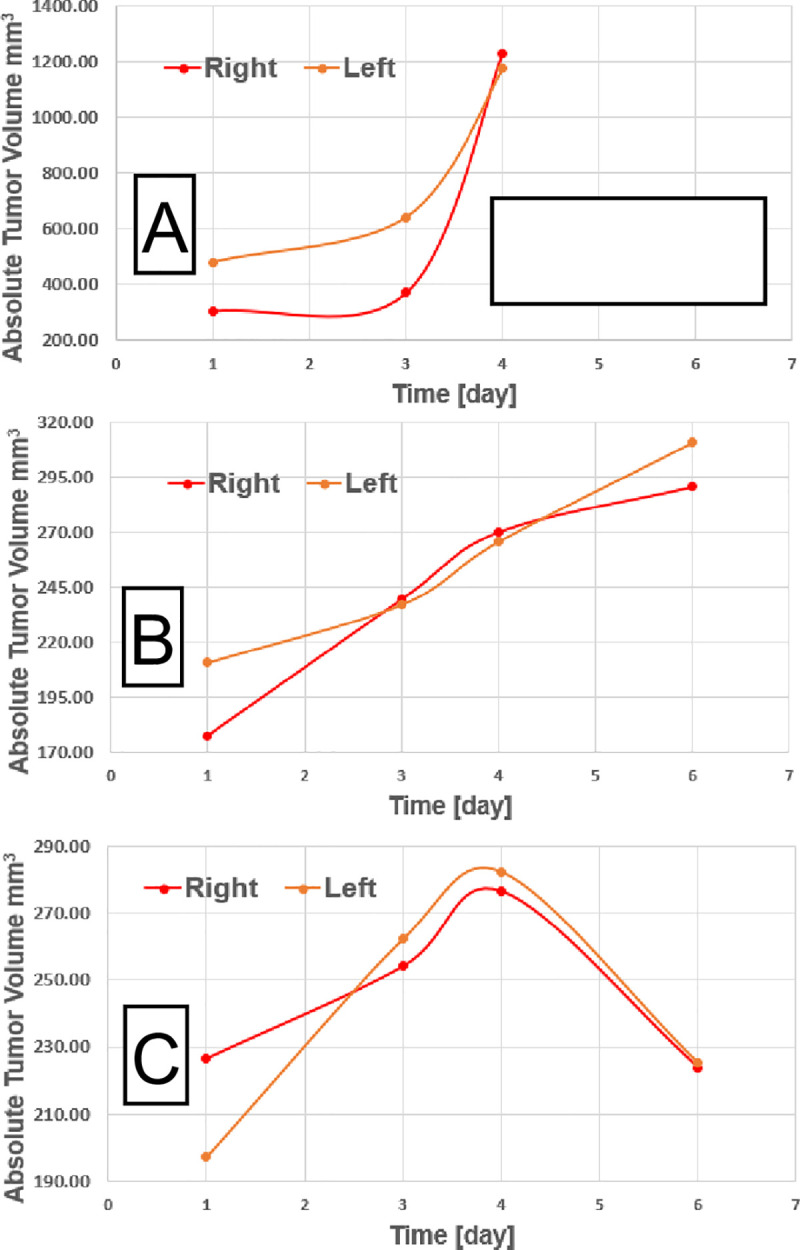
Fig 3. Tumor size temporal evolution for several animals.

The red line depicts right-flank (treated with RT) tumor volume, while the orange line is left-flank tumor volume. The volumes are absolute and day 1 is at time of CT- and MRI-imaging. A) Control animal (untreated) tumors, with rapid growth, B) Delayed tumor growth, but no abscopal since the untreated with RT tumor (left) grows faster than the treated with RT tumor (right), C) Abscopal effect case, since both treated with RT (right) and untreated with RT (left) tumors respond similarly with time.
