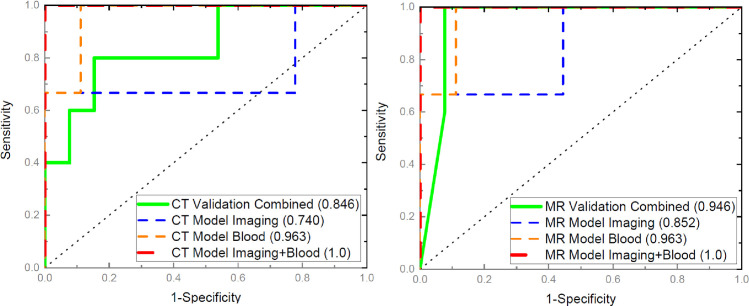
Fig 4.
CT (left) and MRI (right) ROC curves for selected radiomics features, blood counts, and composite radiomics and blood counts, which exhibit statistical significance in predicting abscopal effect as inferred form Fig 2. The dashed lines are from the training set, where the blue lines are from radiomics (CT: surface-to-mass ratio +2D Kurtosis+Average Gray; MRI: 2D Kurtosis+3D IMC), the orange lines are from blood counts (neutrophil-to- lymphocyte ratio), and the red lines are from the combined radiomics and blood counts. The solid lines are from the vlaidation set, where the green lines are rthe cruves from the combined binary logistic model including radiomics and blood counts. The corresponding AUCs are presented in parethesis in each figure legend.

