. 2021 Jul 30;10:e60747. doi: 10.7554/eLife.60747

Figure 4. Characterization of organoid cultures from liver explants of HBV-infected patients.

(A) Representative panel showing the procedure to generate organoid cultures or biobanks from liver tissue. (B) Hematoxylin-eosin-stained sections of explanted liver tissue and phase-contrast pictures showing the morphology of liver organoids derived from hepatitis B virus (HBV)-infected individuals. (C) Expression profile of the progenitor markers LGR5, KRT7, HNF4α, and Sox9 in EM (undifferentiated) organoids derived from liver of healthy donors (hD) (n = 4) and HBV-infected individuals (iP) (n = 5). Levels of expression were calculated according to the 2ΔCT method using GAPDH as the reference gene. (D) Differentiation capacity of organoid cultures derived from liver of hDs (n = 4) and iPs (n = 5). Bars represent the fold difference in the expression of hepatocyte-specific genes encoding albumin, cytochrome CYP3A4, and sodium taurocholate co-transporting polypeptide (NTCP), and the progenitor-specific gene LGR5 in DM (differentiated) cultures compared to EM organoids using the 2ΔΔCT method. (E) Immunofluorescent staining targeting albumin (green) and HNF4α (red) was performed in EM and DM organoids. Phase-contrast images, depicting the morphology of the cells, are shown as reference.

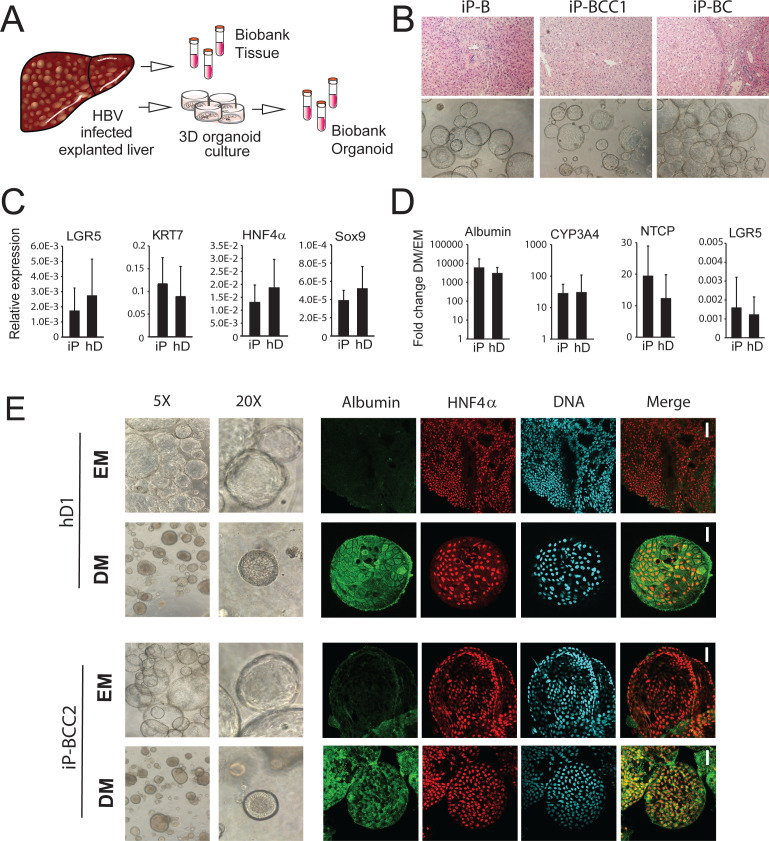
Figure 4.

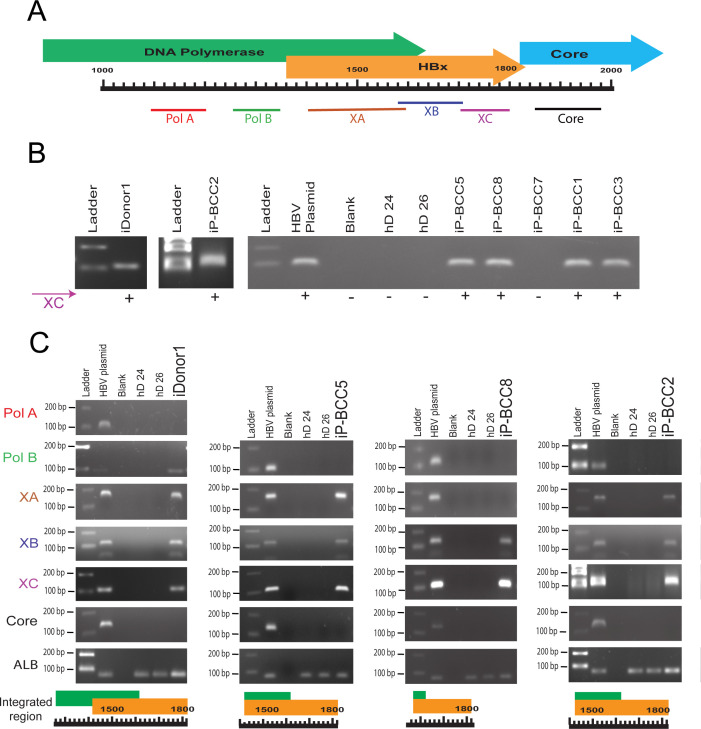
Figure 4—figure supplement 1. Parts of HBV genome are found integrated in patient-derived liver organoids.

Figure 4—figure supplement 1.

(A) Partial genome map of hepatitis B virus (HBV) with gene names and primer positions used for identifying the integrated regions. (B) Agarose gel electrophoresis of polymerase chain reaction (PCR)-amplified products of six infected patients (iPs) and one infected donor (iDonor1) using XC primer set. (C) Agarose gel electrophoresis of four organoid lines that show integration with XC primer set. Primer pairs in both upstream (PolA, PolB, XA, and XB) and downstream (Core) directions of XC region were used to identify the integrated region of HBV inside the genome of organoid lines.
Figure 4—figure supplement 1—source data 1. Source data for Figure 4—figure supplement 1B.
Figure 4—figure supplement 1—source data 2. Source data for Figure 4—figure supplement 1C.
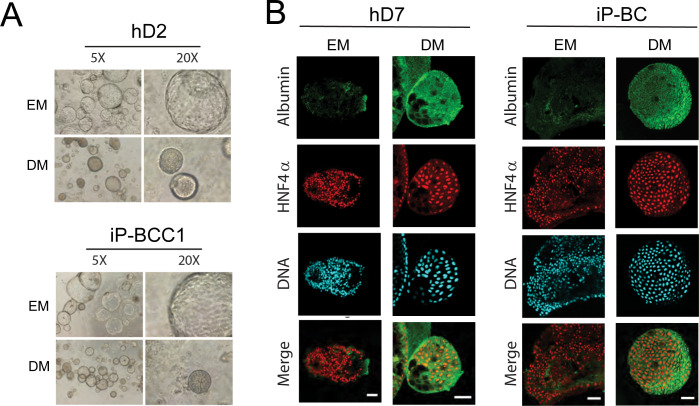
Figure 4—figure supplement 2. iP-derived and hD-derived organoids have comparable differentiation potential.

Figure 4—figure supplement 2.

(A) Phase-contrast images (5X and 20X magnification) of organoid cultures seeded from healthy donors (hDs) and infected patients (iPs) show comparable morphological changes in the organization upon differentiation of organoid cultures. (B) Immunofluorescent staining indicates comparable expression of the hepatocyte marker Albumin (green) and HNF4α (red) in hD and iP liver organoids in expansion media (EM) and after 7 days of culture in differentiation media (DM). Nuclei are counterstained with Hoechst 33342 (cyan). Scale bars represent 50 µm.