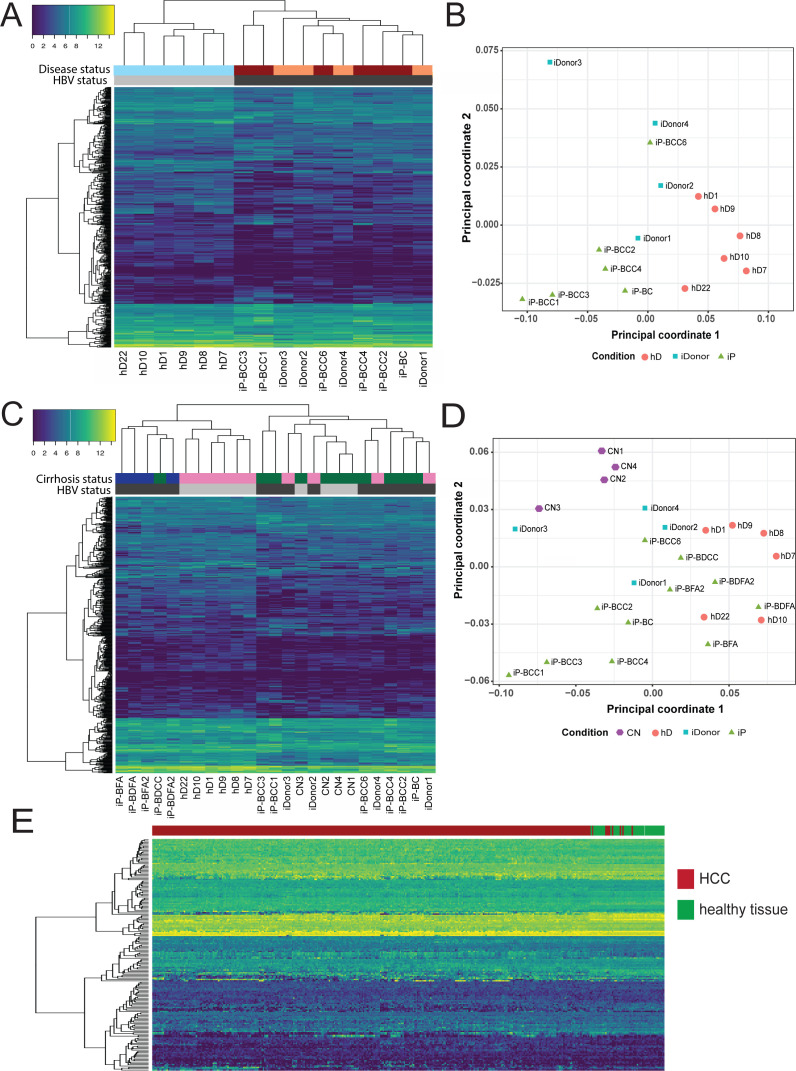
Figure 6. Characterization of early HCC gene signature.
(A) Hierarchical clustering heatmap of six infected patient (iP), six healthy donor (hD), and four infected donor (iDonor) samples depicting the grouping and expression levels of protein-coding differentially expressed genes derived from the comparison between the group of five hDs and five iPs presenting hepatitis B virus (HBV) infection, cirrhosis, and hepatocellular carcinoma (HCC) (four out of five) (from Figure 5A). Colored bars on top of the heatmap indicate HBV status (black for HBV-positive patients, gray for healthy donors) and disease status (maroon for HBV-positive cirrhosis and HCC, orange for healthy donors that have cleared HBV infection, sky blue for healthy donors that have not been infected with HBV). (B) Multidimensional scaling plot of iP (green triangles), hD (orange circles), and iDonor samples (blue squares). (C) Hierarchical clustering heatmap of all 11 iP, 6 hD, 4 CN, and 4 iDonor samples depicting the grouping and expression levels of protein-coding differentially expressed genes derived from the comparison between the group of five hDs and five iPs presenting HBV infection and HCC (four out of five) (from Figure 5A). Colored bars on top of the heatmap indicate HBV status (black for HBV-infectected patients and donors, gray for non-HBV infected healthy donors and CN patients ) and cirrhosis status (green for cirrhotic livers, blue for acute HBV-infected non-cirrhotic livers, and pink for non-cirrhotic livers from both healthy and infected donors). (D) Multidimensional scaling plot of iP (green triangles), hD (orange circles), CN (purple pentagons), and iDonor samples (blue squares). (E) Hierarchical clustering heatmap of liver HCC gene expression data from 342 HCC tissue samples and 47 samples from matched nearby tissue from The Cancer Genome Atlas (TCGA) using the HBV-iP vs hD gene signature (from Figure 5A).

