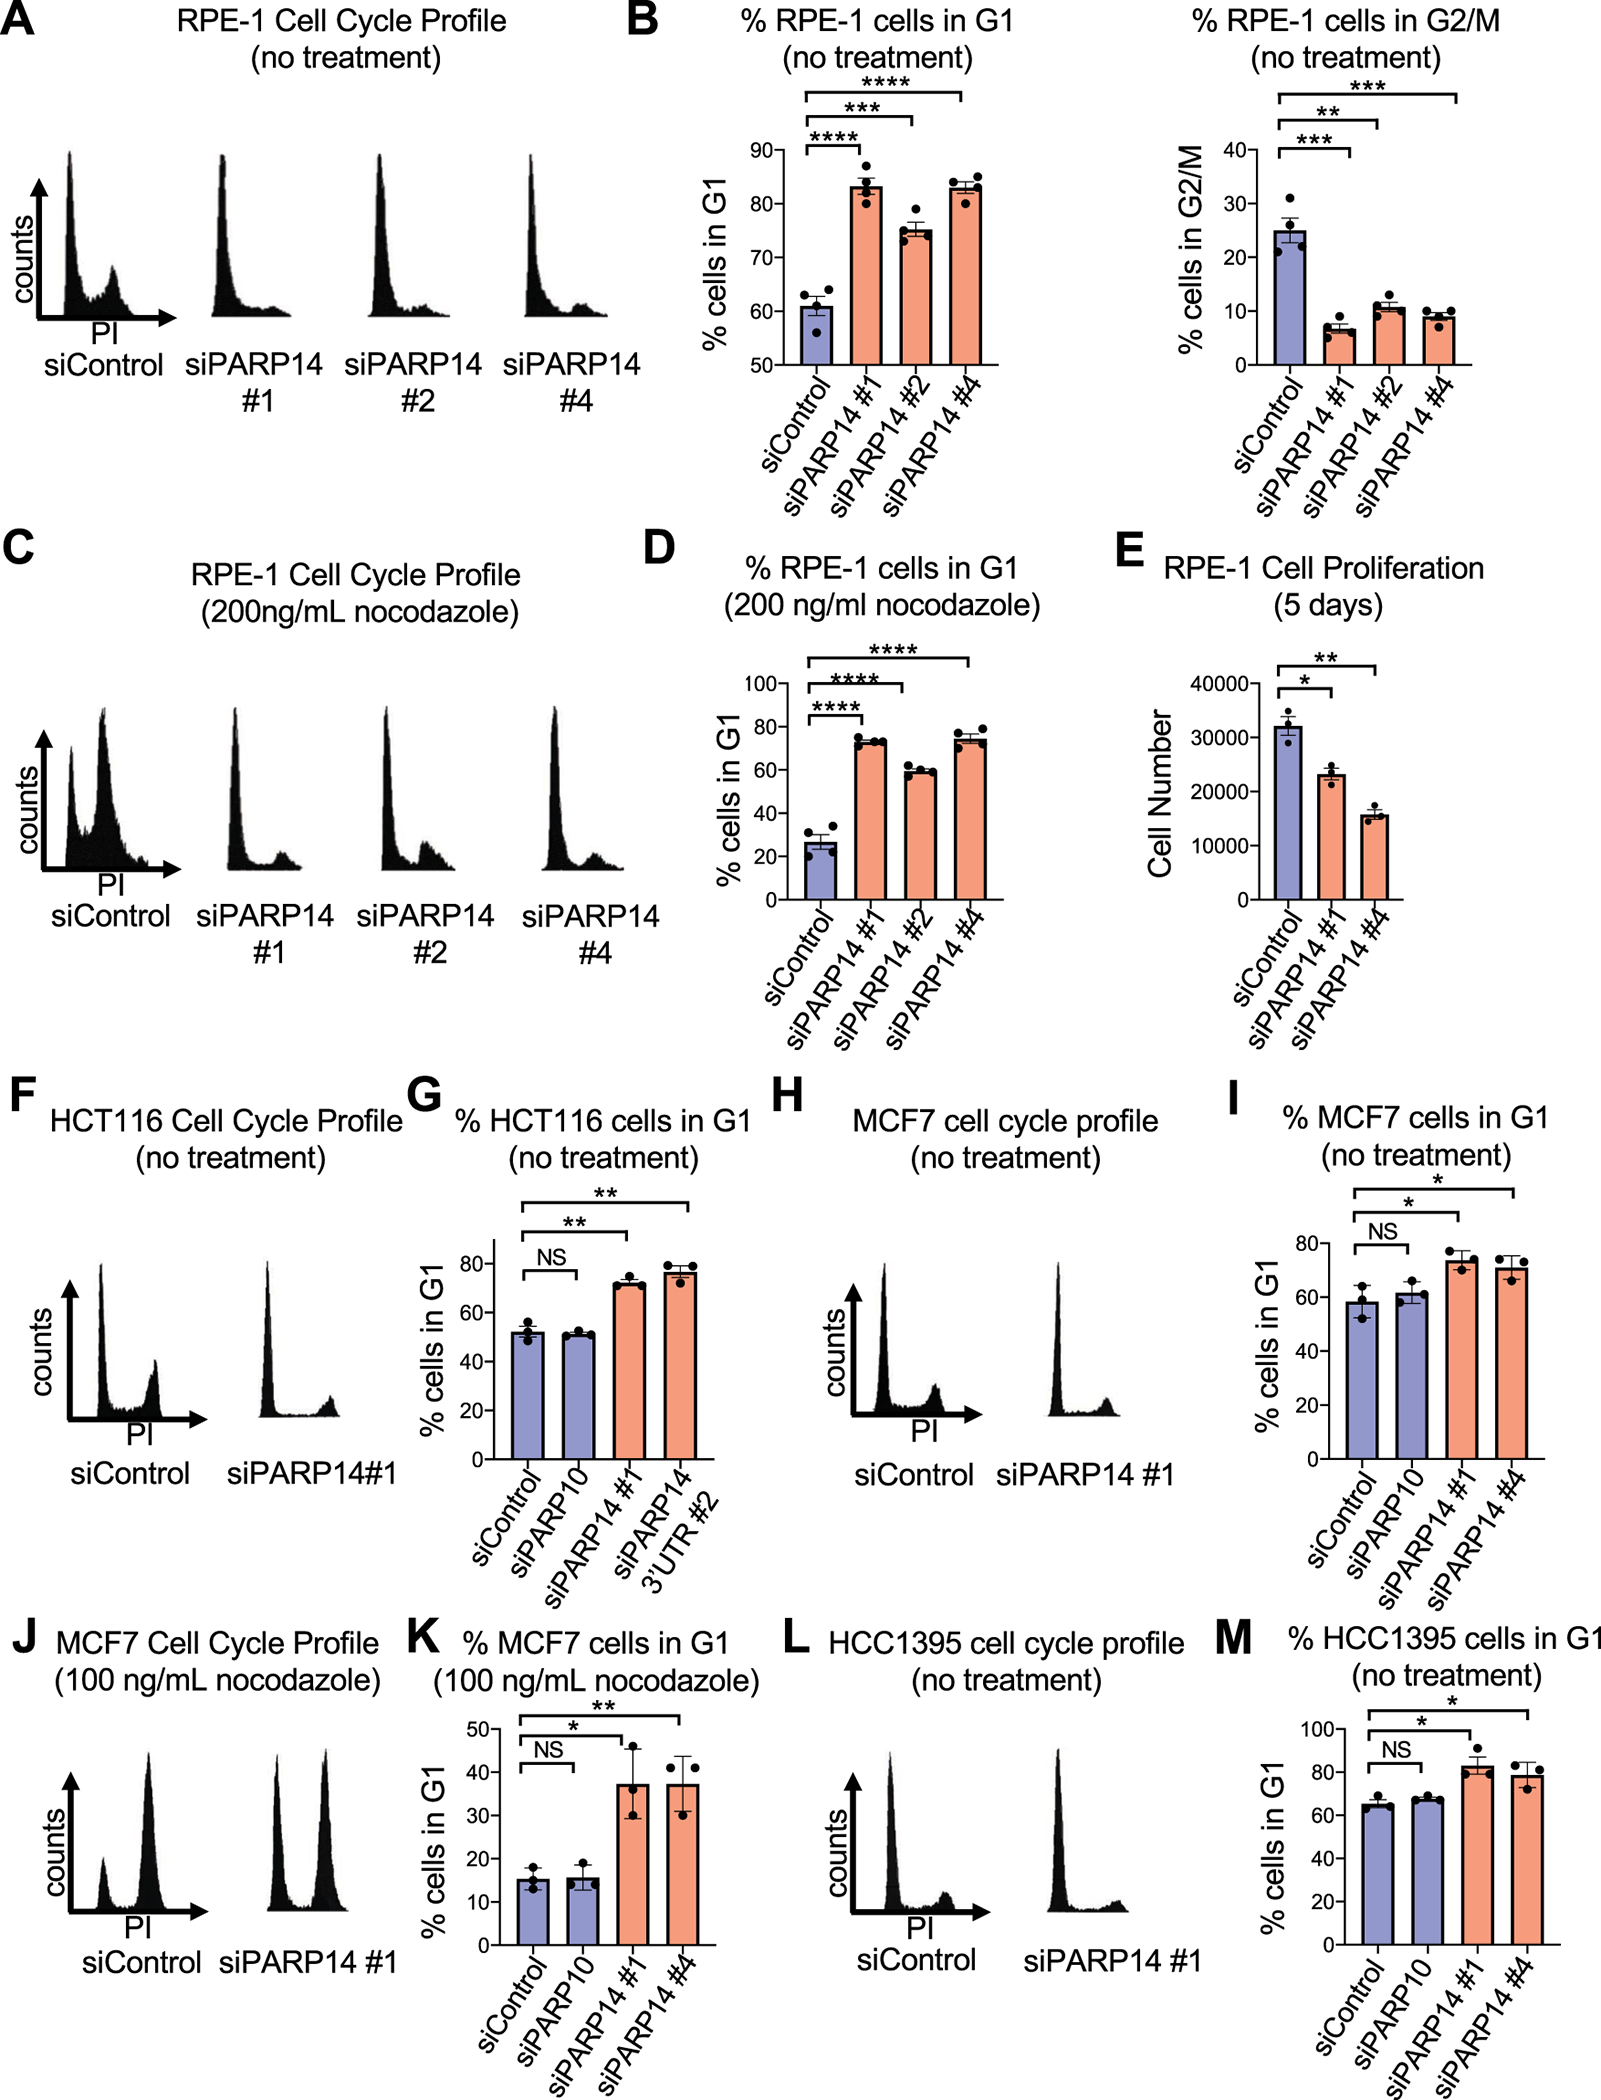
Figure 1. PARP14 is required for cell cycle progression.

A. Cell cycle profiles of RPE-1 cells after PARP14 knockdown. B. Quantification showing the percent of RPE-1 cells in G1 and G2/M cell cycle phases upon PARP14 knockdown. Bars represent the means ± SEM (t-test, unpaired). C. Cell cycle profiles of RPE-1 cells after PARP14 knockdown and subsequent treatment with 200ng/mL nocodazole for 24h. D. Quantification showing the percent of RPE-1 cells in G1 cell cycle phase upon PARP14 knockdown and subsequent treatment with 200ng/mL nocodazole for 24h. Bars represent the means ± SEM (t-test, unpaired). E. Proliferation assay in RPE-1 cells showing the impact of PARP14 knockdown. Bars represent the means ± SEM (t-test, unpaired). F. Cell cycle profiles of HCT116 cells after PARP14 knockdown. G. Quantification showing the percent of HCT116 cells in G1 cell cycle phase upon PARP14 knockdown. Bars represent the means ± SEM (t-test, unpaired). PARP10 knockdown was used as a second control. Bars represent the means ± SEM (t-test, unpaired). H. Cell cycle profiles of MCF7 cells after PARP14 knockdown. I. Quantification showing the percent of MCF7 cells in G1 cell cycle phase upon PARP14 knockdown. Bars represent the means ± SEM (t-test, unpaired). J. Cell cycle profiles of MCF7 cells after PARP14 knockdown and subsequent treatment with 200ng/mL nocodazole for 24h. K. Quantification showing the percent of MCF7 cells in G1 cell cycle phase upon PARP14 knockdown and subsequent treatment with 200ng/mL nocodazole for 24h. Bars represent the means ± SEM (t-test, unpaired). L. Cell cycle profiles of HCC1395 cells after PARP14 knockdown. M. Quantification showing the percent of HCC1395 cells in G1 cell cycle phase upon PARP14 knockdown. Bars represent the means ± SEM (t-test, unpaired).
